Market Update – July 9
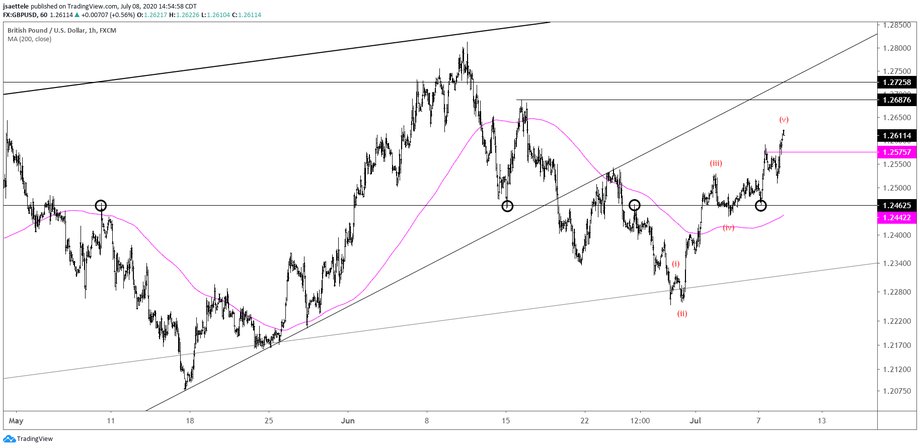
GBPUSD HOURLY
I remain broadly constructive GBPUSD but price could pull back from the current level, which is defined by 2020 VWAP (see 2 charts down). I’m showing 2 technical interpretations. An Elliott interpretation is that 5 waves up are complete or nearly so and that price should pull back towards the area of the prior 4th wave. 1.2460s, which is a clear horizontal level and near VWAP from the June high and June low, would be of interest for support. An alternate interpretation is shown below in which a head and shoulders bottom completed today. Under this scenario, support should be 1.2565/75 and the objective is 1.2808 (in line with the June high). Bottom line, be aware of 1.2565/75 as the initial level for support. If price reacts at that level, then there’s the opportunity to buy with a tight stop.
GBPUSD HOURLY

BRITISH POUND FUTURES 2 HOUR

EURUSD 4 HOUR

We nailed EURUSD support (1.1261) and the view remains that a 5th wave is underway towards 1.1460. The 7/2 high at 1.1303 ideally holds. Also notice the many inflection points near the 75 line. That line is just above 1.1300.
7/6 – The EURUSD drop from 6/10 to 6/19 retraced exactly 38.2% of the rally from 5/7. 4th waves often retrace 38.2% of 3rd waves. The implication is that EURUSD is headed higher in a 5th wave. A possible target is where wave 5 would equal wave 1 at 1.1460. The high volume level at 1.1261 is a good spot for support (the year open is 1.1260 by the way). Be aware of the current ownership profile however (see below). Speculators are the most long since the 2017 high. Extremes in positioning can last for extended periods of time but you don’t want to get caught holding the bag if price reverses (use stops!). As the famous 19th century Dickson Watts said, ‘go cautiously with the crowd and boldly against.’ In summary, EURUSD is set up to exceed the June high before reversing lower.
USDJPY 4 HOUR

USDJPY focus remains on the center line of the channel from the March high. That line is currently about 106.70. Resistance now should be 107.45/50 (7/1 close and weekly open). Be aware of the bigger picture. Yen futures (see below) held 2020 VWAP and VWAP off of the February low the last 2 weeks. As such, strength through the center line (below in spot and above in futures) could lead to sharp acceleration in the Yen move (lower in spot and higher in futures).
7/1 – USDJPY completed its flat and reversed from the well-defined 108.00/08, carving a bearish outside day today. 108.00 is the 61.8% retrace of the February-March decline. 108.08 was high print a number of days in April and May. The fractal nature of markets is on display in the chart below. The pattern from 6/5 to today is the same shape as the pattern from 3/24 to 6/5. That’s a fractal! Finally, I like that Yen futures held 2020 VWAP and VWAP from the February low. Very short term focus is on 106.92 although significant downside potential exists in USDJPY as long as price is under today’s high. 107.71/89 (high volume level and 6/29 high) is resistance.
JAPANESE YEN FUTURES DAILY

USDCAD 4 HOUR

USDCAD continues to trade perfectly within the channel from the March high. Respect bounce potential from well-defined parallels in the 1.3470/90 zone. Proposed resistance now is 1.3545/60 (7/1 low and week open). Broad focus is lower as long as price is within the channel. The obvious level to look towards is the June low at 1.3315, which intersects the center line early next week.
7/6 – The USDCAD rally from 6/10 is clearly in 3 waves and the decline from 6/26 is in 5 waves. Expectations are for a bounce before additional downside within the bearish channel from the March high. Ideal resistance is 1.3617/30. This is the high volume level from last week, 6/22 high, parallel within the channel (magenta line), and underside of the just broken trendline. The futures chart below shows CAD VWAP from the 6/26 low (high in USDCAD) and 2020 VWAP, which would be the equivalent of 1.3420s in USDCAD.
GBPAUD HOURLY

My view is that GBPAUD has been forming a bullish base to work higher from since late June (longer term chart with sliding parallel shown below). Ideal support now is 1.7975-1.8000. Basically, pay attention to the 200 hour average.
7/1 – I’m zooming in on the GBPAUD chart to show the break above the trendline (blue line) from the 5/3 high. The top side of this line is proposed support for entry along with the 6/30 high at 1.7972. Swing upside focus is the 6/12 high at 1.8452, which intersects the center line of the channel from the March high.
GBPAUD DAILY


