Market Update: October 20
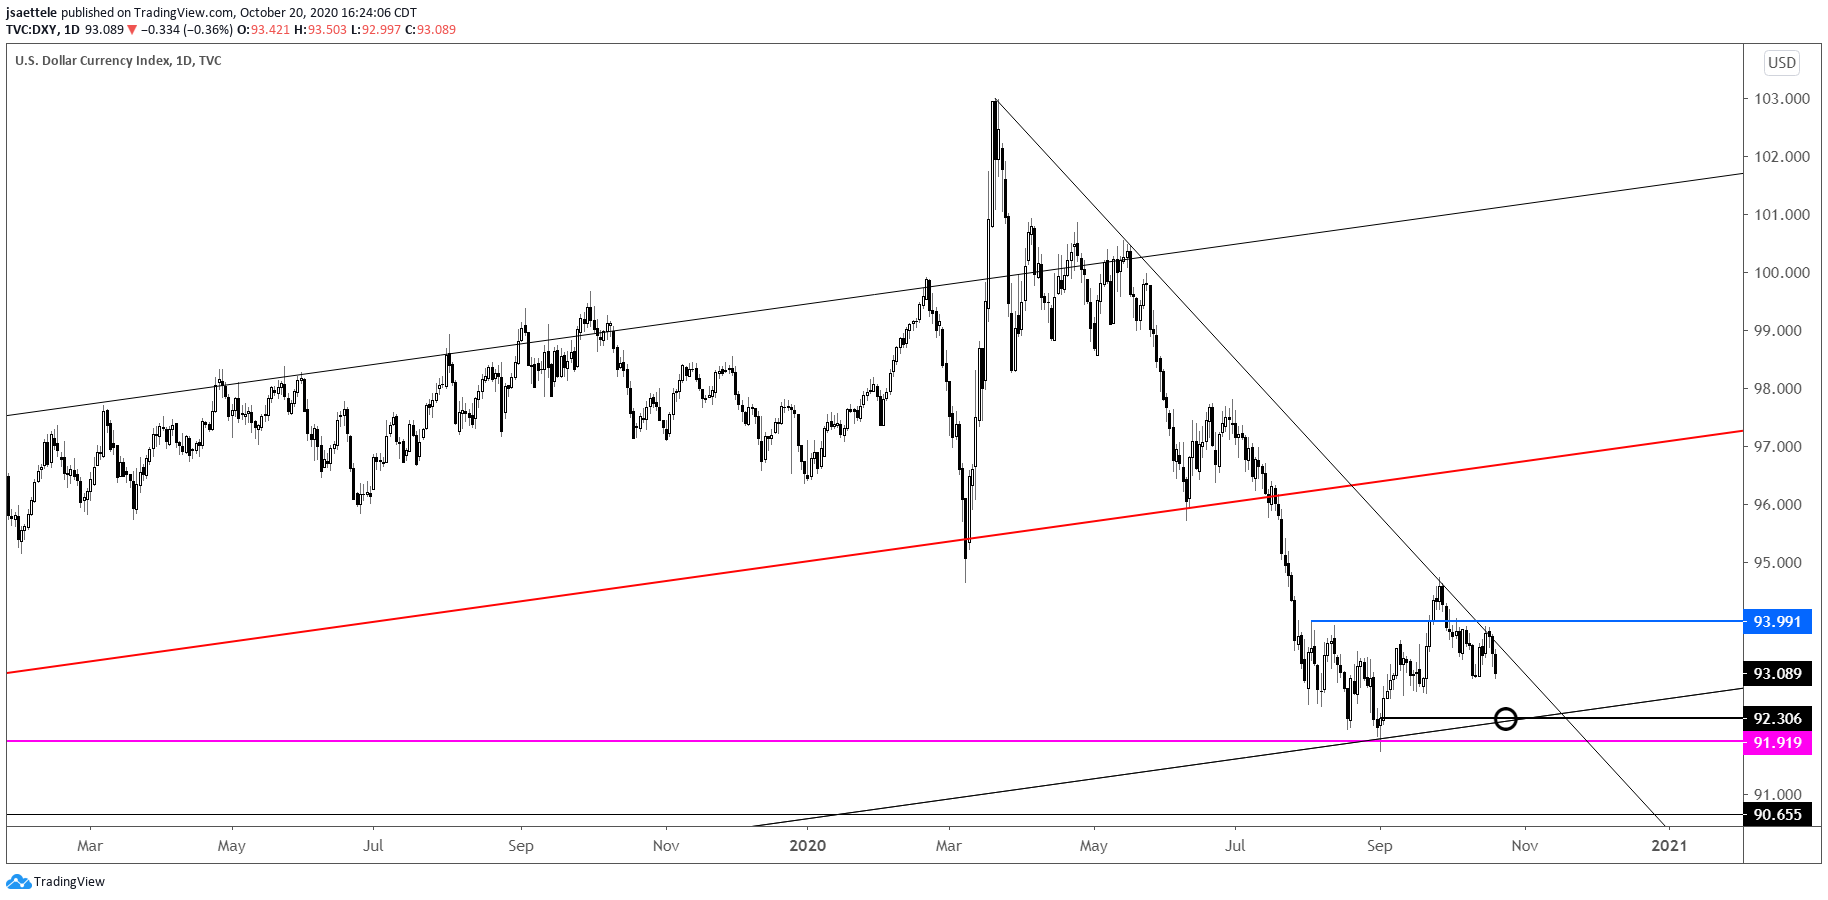
DXY DAILY

DXY continues to fail at channel resistance and ABOVE 94 is still needed to signal that trend has shifted from sideways to up. Until/unless that happens, be aware of another test of the long term support line near 92.30 (daily reversal support). 2 equal legs down from the 9/25 high would be 92.18. A longer term chart is shown below in order to remind that important support is under the market.
10/14 – In the 3 months leading up to a U.S. presidential election, 1980 is most similar to the current period for DXY. Is Trump analogous to Carter? Is Biden analogous to Reagan? Is Carter’s mishandling of the Iranian hostage crisis analogous to Trump and Covid? Pure conjecture and not all that useful in my opinion but the 2 time series ARE similar. If the relationship continues, then the USD is about accelerate higher. A break above 94 in DXY (see 4 hour chart below) would serve as the bullish trigger. Remember that DXY remains above a major long term level as well (see weekly chart 2 chart down).
DXY DAILY

EURUSD 4 HOUR

EURUSD took out last week’s high today and tagged the upper parallel of the bearish fork that we’ve been following in the process. Proposed resistance is now to 1.1870. EURUSD needs to roll over between now and then in order to maintain a near term bearish stance. 1.1870 is the 9/18 amd 9/21 highs. The line that extends off of highs in March and June is up there too. That line crossed the 9/17 low and highs in early October. I’ll keep an eye on volume metrics and alert you in the event of a reversal signal.
NZDUSD 4 HOUR

Kiwi action since late July looks like a textbook topping pattern. If the cross is going to break down sooner rather than later, then .6620 should provide resistance. A break under the line off of the 6/30 and 9/24 lows would suggest that a mark down is underway towards .6350/80 (bearish lower parallel and mid-June support).
EURJPY 4 HOUR

Pay attention to 125.60/80 in EURJPY. The zone is defined by corrective channel resistance and 2 equal legs up from the 9/28 low. There are better ways to play possible downside in Yen crosses (AUDJPY for example) but if Yen crosses are headed lower in general then I’d expect the noted zone to hold in EURJPY.
AUDJPY 4 HOUR

AUDJPY has been churning around the center line of the short term bearish channel for the last 4 days. Markets have a tendency to ‘range’ around the median line before moving sharply in the direction of the trend…in this case down. 75.00ish is well-defined and I’m expecting price to stay beneath that level on its way to the lower parallel, which intersects the 6/12 low at 72.53 early next week.
10/13 – Look at that 200 period average on the 4 hour chart in AUDJPY…impressive! Focus is lower as a result. 75.70s is proposed resistance now (see hourly chart below). Eventual downside is significant as per the failed breakout on a longer term basis (see weekly chart 2 charts down). Downside swing levels to target are 72.00/50 (4th wave support in June and 2 equal legs down) and low 69.00s (50% retrace of rally from March and 161.8% extension).


