Market Update – July 8
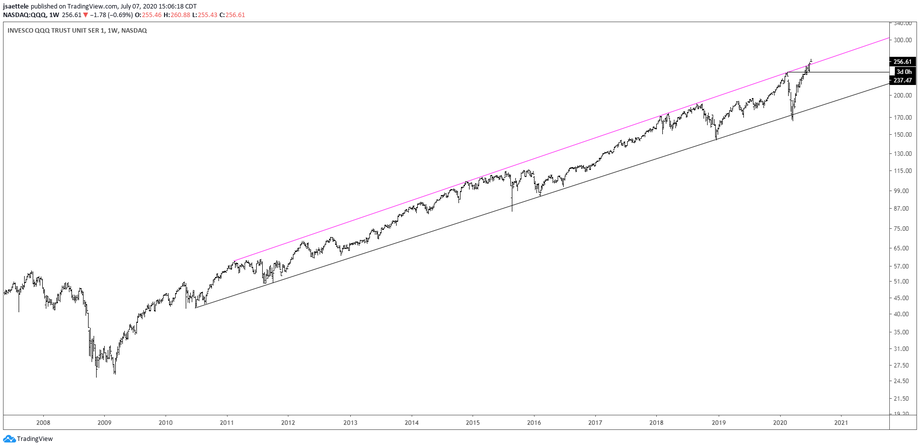
QQQ WEEKLY
‘Risk’ may have put in an important high today. The following charts ‘explain’ why.
QQQ is trading above the line (magenta line) that connects virtually every high since 2011 but reversed lower today. Dropping back below the line would suggest that the rally was terminal. Near term (see below), QQQ reversed from the top of a short term channel. The bottom of the channel is about 246.30. A break below would be a sell signal. Finally, futures made an 8 hour volume reversal today (2 charts down). These reversals haven’t worked since Q4 2018 (nailed the highs then). As always, follow through is key.
QQQ HOURLY

NASDAQ FUTURES (NQ) 8 HOUR

SPY HOURLY

SPY has been dancing around the line that connects the 2018 highs since early June. This line has proved a useful reference point since November so I view the drop below the line today as bearish. Also, the rally from the March low subdivides by 61.8% (C=A x .618).
COPPER DAILY

Copper has traded to the 61.8% retrace of the decline from the 2018 high. This level has also produced some big pivots over the last 10 years. Price is also trading on the center line of the channel from the March low (see below). Bottom line, the current level is well-defined for resistance.
COPPER 4 HOUR

FCX (FREEPORT) WEEKLY

FCX has traded into the trendline from the 2014 high and 200 week average. Similar to copper, this is a great level for price to turn over. A daily volume reversal also triggered today (see below). The last 2 signals nailed big tops. I’m bearish.
FCX DAILY

TLT HOURLY

TLT is constructive after finding support at the 200 hour average and top side of a short term trendline. Trade since early May has a head and shoulders bottom look as well. This may be the pattern that propels TLT to all-time highs.
FCX (BLUE), AUDUSD (BLACK), AND COPPER (RED) HOURLY

FCX, AUDUSD, and copper have moved nearly tick for tick in 2020. As such, the major levels that FCX and copper have traded into along with the volume reversal in FCX, increase confidence in a bearish AUDUSD view.
AUDUSD 4 HOUR

AUDUSD traded into noted support today but I don’t think it holds given the view on copper and FCX. High today was at daily reversal resistance (6/10 close) and price remains under the year open (.7015). The 25 line continues to provide resistance as well. This is a warning that price will indeed break the lower parallel and head towards the full channel extension. I’ll short a break under .6920 and look towards .6680s or so.
7/6 – The idea that a triangle was unfolding in AUDUSD was nullified after price took out the 6/23 high. As long as price holds the lower parallel of the Schiff fork from the March low, I have to respect additional upside. If it breaks, then I’ll turn bearish. Ideal support is .6912/24. This AUDUSD chart is basically the opposite of the USDCAD chart. Pay attention to the median line, which is just above the 6/10 high at .7064, for resistance. Be aware that RBA is today.
NZDUSD 4 HOUR

NZDUSD tagged the line off of the April 2018-December 2019 highs today and made a doji in the process. Focus is lower towards the bottom of the ‘box’ and lower parallel of the channel from the March low at .6380 then reassess. I like the AUDUSD short better. AUDNZD (not shown) sports a head and shoulders top since late April.
AUDJPY 4 HOUR

The AUDJPY rally from the June low retraced exactly 61.8% of the preceding decline. Don’t forget that the June high is at a major level as well (December high and support for the base in 2016). Look to short a break below the red line that crosses highs and lows since April. Initial focus on a break would be 70.00/50 (2019 lows and 38.2% retrace of rally from March).


