Market Update 10/18 – USDJPY Nears Big Zone
SPOT SILVER 4 HOUR
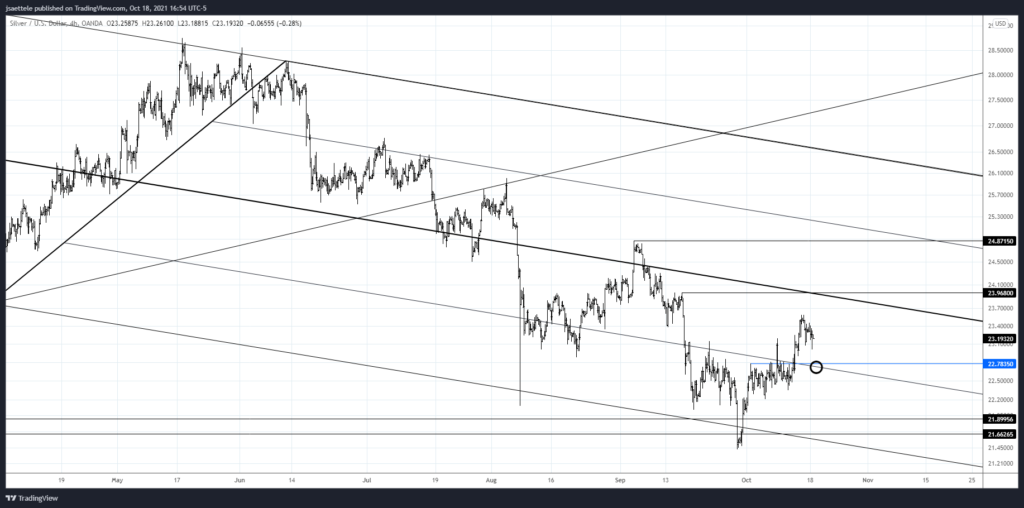
Focus for silver support remains 22.78 (or so). Again, I favor longs into this level with and upside objective of 24.87.
10/13 – Silver has broken above and established above the 25 line so that line is now proposed support near 22.78. The inverse head and shoulders objective is 24.87, which is also the September high. 23.97 is pullback resistance. From a bigger picture perspective, SLV made a weekly volume reversal at the low 2 weeks ago (see below). Finally, silver has turned up from a 8 month channel and the bottom year+ range and sentiment is downright brutal as evidenced by articles such as EXCLUSIVE Banks prepare to scrap LME gold and silver contracts, sources say.
SPX DAILY
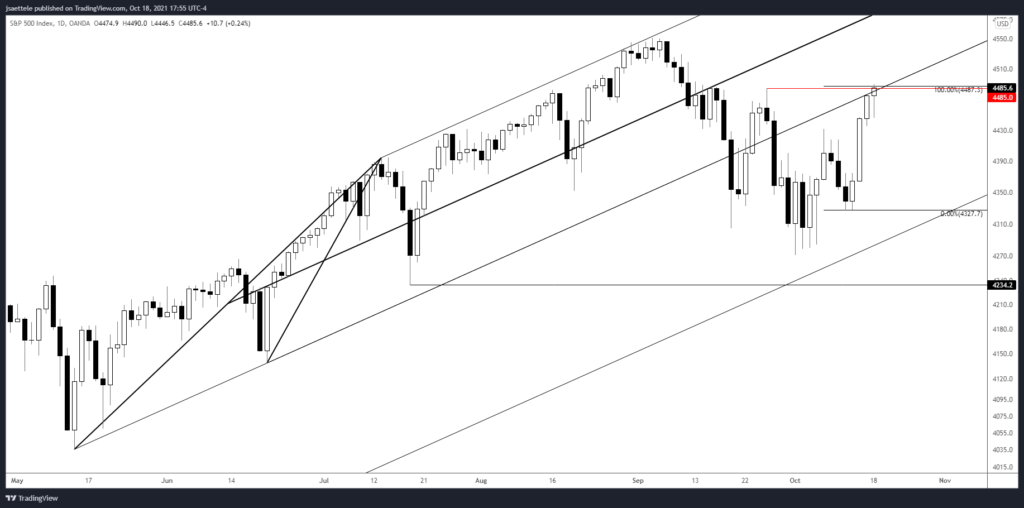
Pay attention to SPX up here. Price has reached the 9/27 high. It’s also where the rally from 10/1 consists of 2 equal legs and the underside of former channel support (line that extends off of the May and June lows). At this point I’m looking for nothing more than a pullback with former resistance at 4431.80 as proposed support.
BTCUSD DAILY
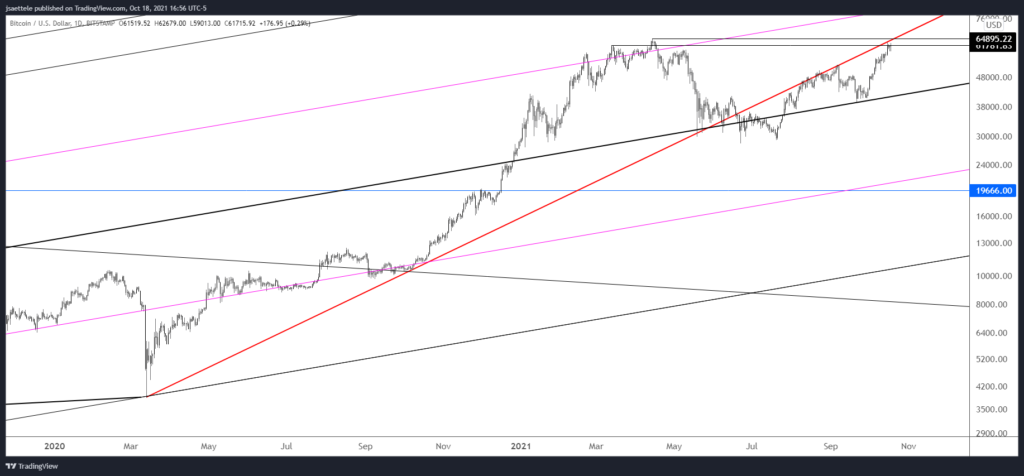
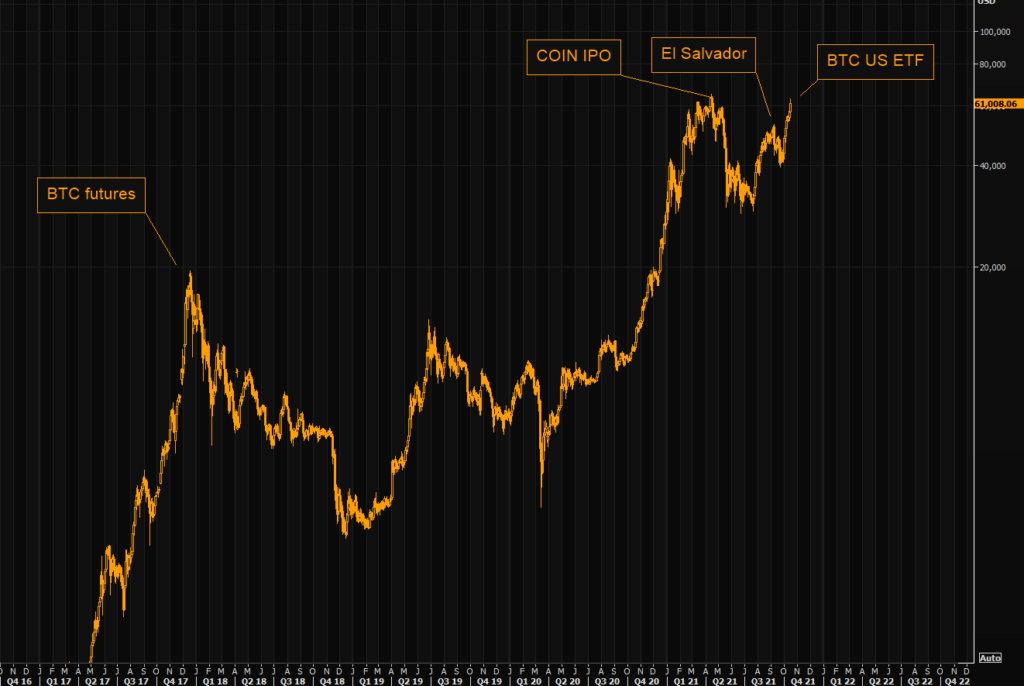
BTCUSD remains pinned to the highs from early in the year. This is obvious chart resistance from those highs but also from the underside of former trendline support. From a sentiment perspective, it’s worth noting that the first BTCUSD ETF was approved. Previous milestones, such as the launch of futures and the COIN IPO, marked highs (see below). I’m thinking that happens again now.
FXE WEEKLY
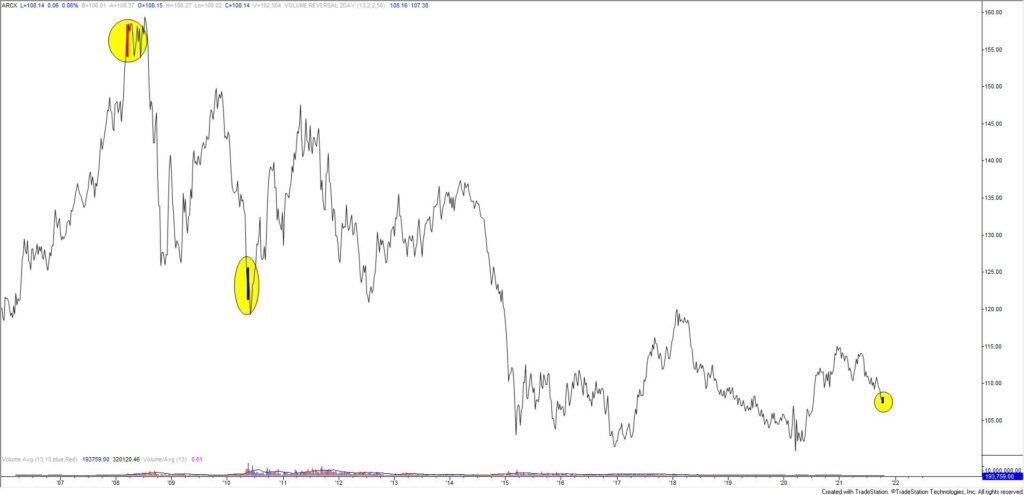
FXE (euro ETF) completed a 2 week volume reversal last week. Volume was over 2 x the 13 week average both last week (up week) and the prior week (down week). This setup has only occurred 2 other times (circled on the chart). Both times were within weeks of major turns. I’m willing to trade the long side against today’s low, which is defended by the month open at 1.1578.
10/14 – The EURUSD rally unfolded in 5 waves, which increases confidence in a bullish stance against the low. The 61.8% retrace should be support at 1.1563. There is nothing else to add other than be aware that we could end up with a bullish key reversal at the 200 week average / 200 week midpoint (see below).
USDJPY DAILY
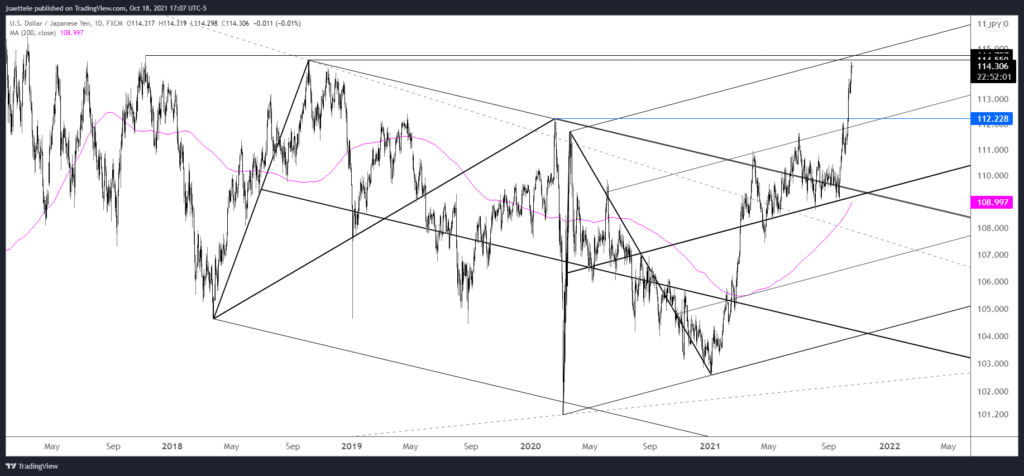
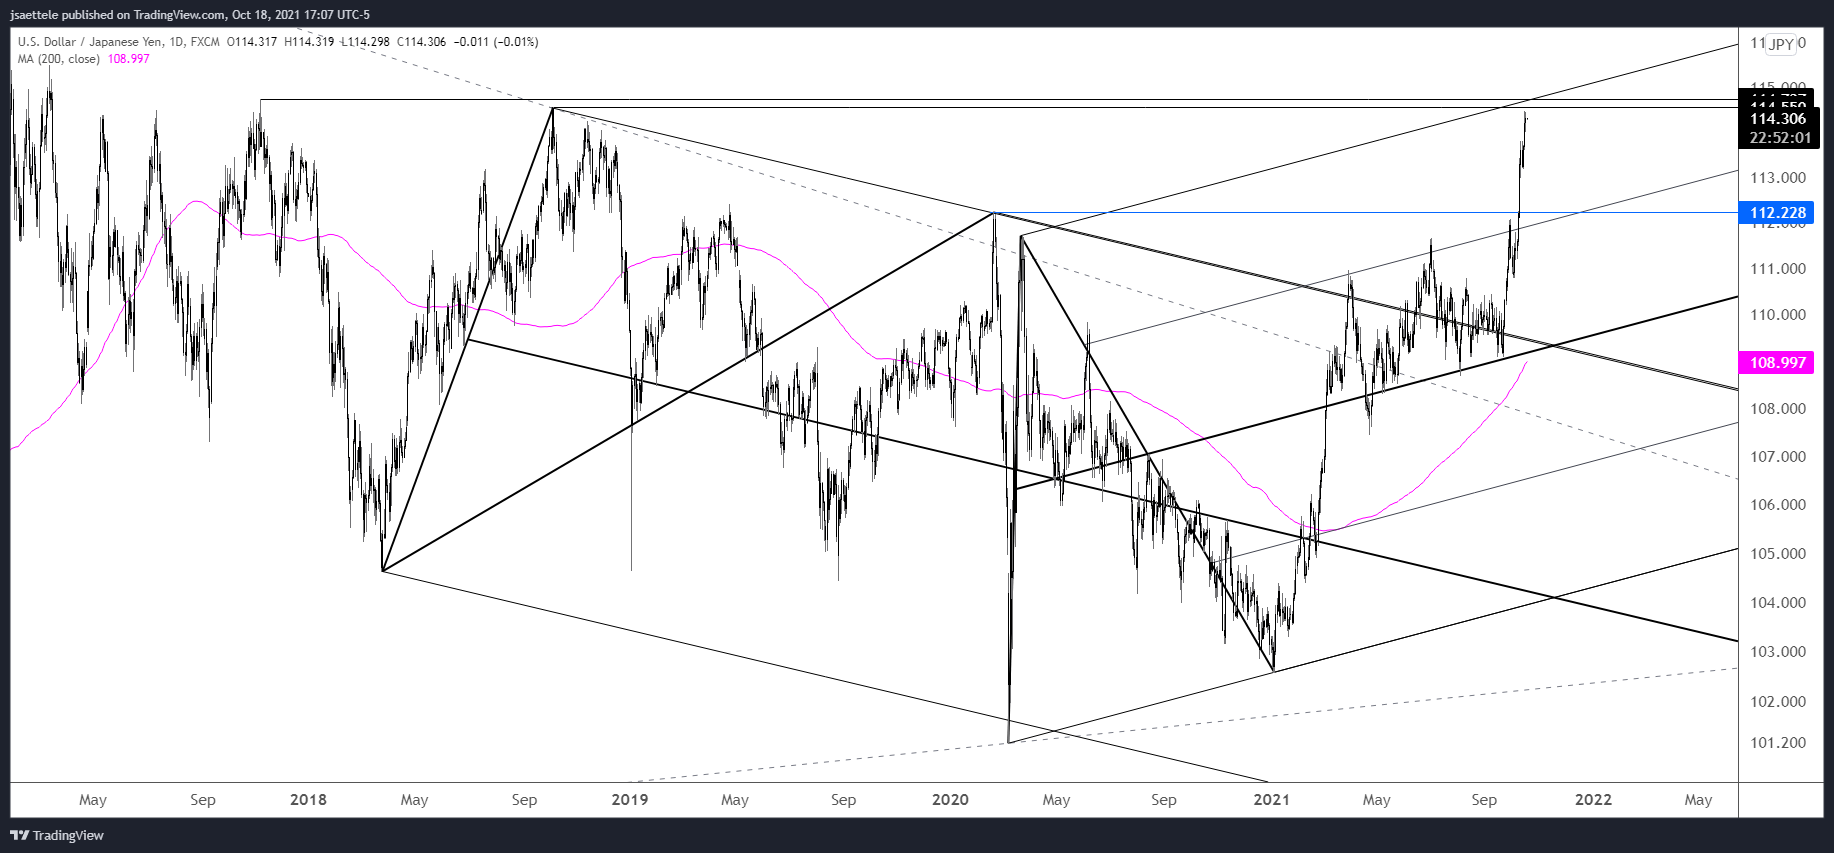
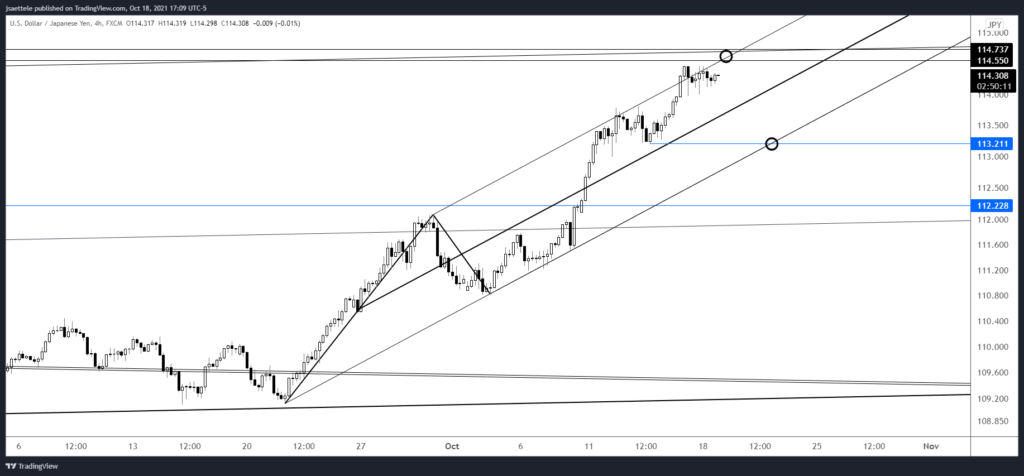
USDJPY has nearly reached the noted zone so pay attention. Aside from channel resistance, the level just above the market is defined by the late 2017 and 2018 highs at 114.55/74. A pullback from the zone would ‘make sense’. If reversal evidence arises, then there may be an opportunity to play the short side although 113.21 is in line for support (see below).
10/11 – The next stop for USDJPY is probably 114.55/74. This is the 2018 high and November 2017 high. It’s also the upper parallel from the channel that originates at the March 2020 low. Price may not pull back until reaching this level but if price does pull back then former resistance is 112.23 is proposed support.
USDJPY 4 HOUR
USDMXN DAILY
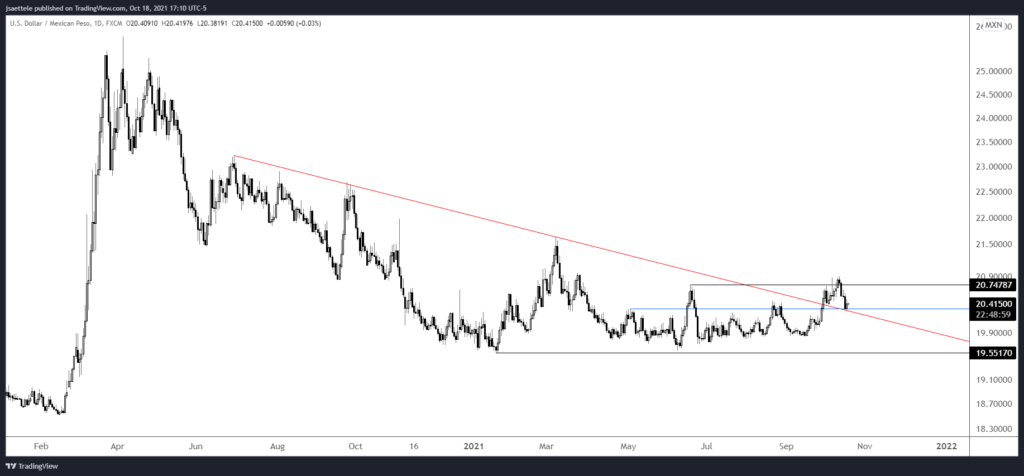
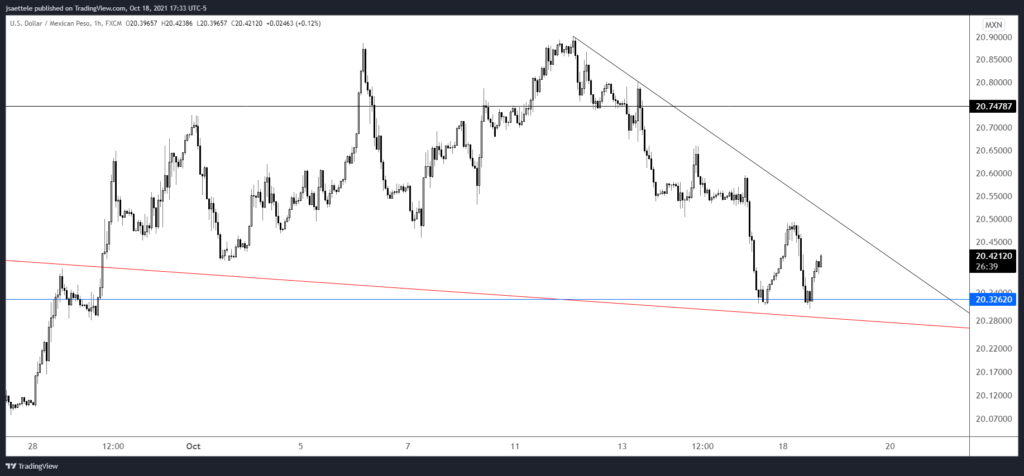
I don’t trade it much but USDMXN is interesting on the long side after price has pulled back and responded to well-defined support from the top side of former trendline resistance. Strength above short term trendline resistance (see below) serves as the long trigger.
USDMXN HOURLY
