Market Update: January 18
BTCUSD WEEKLY

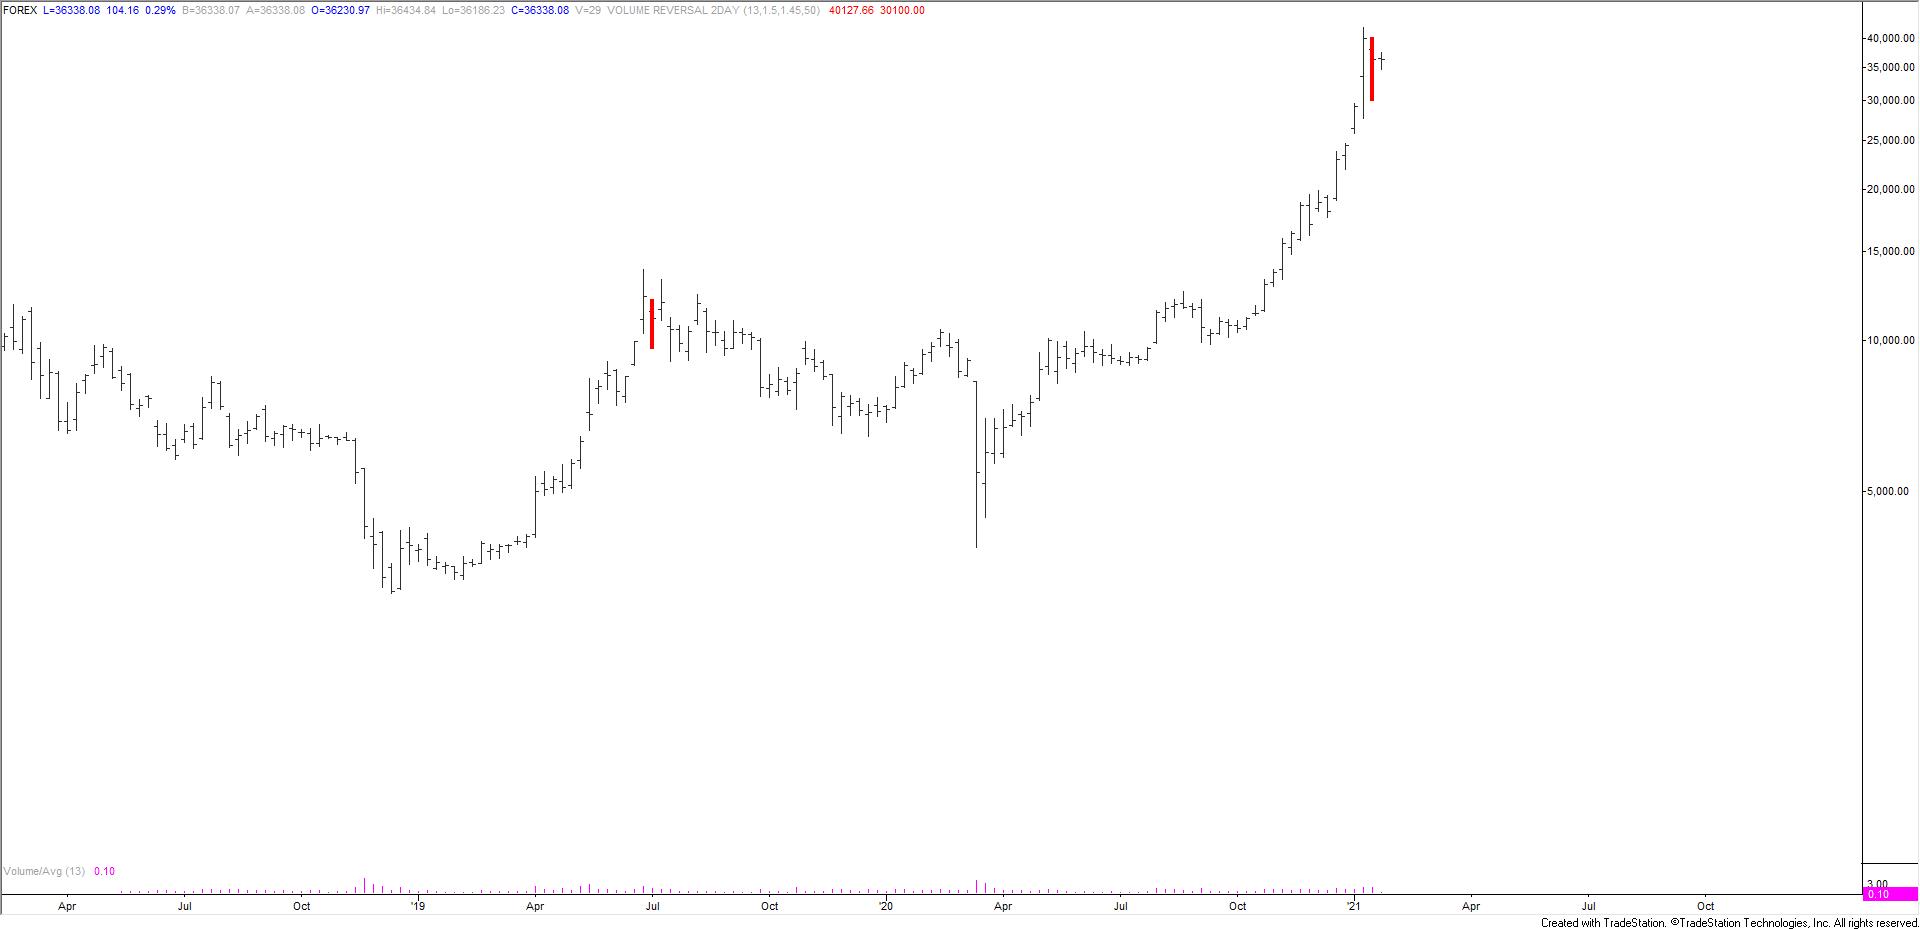
BTCUSD made a 2 bar weekly volume reversal last week. TradeStation historical is limited but this is the 2nd 2 bar weekly volume reversal since 2019. The 2019 signal identified an important top. Bitcoin news mentions have also gone parabolic (see below). This isn’t a surprise but it’s comforting to see the data. In other words, the speculative excess isn’t anecdotal.
1/10 – The Bitcoin rally dwarfs all other ‘bubbles’ in recent financial history (since the end of Bretton Woods). This can’t end well.
BITCOIN NEWS MENTIONS

COPPER 4 HOUR

Copper has been oscillating around the 61.8% retrace of the decline from 2011 for just over a month. Near term, price has reacted from the underside of the channel center line from the March low. This is a minor behavior change but worth noting. As long as price is under the center line, focus is lower towards the lower parallel near 3.45.
DXY 4 HOUR

DXY pulled back on 1/11 and found support from the previously uncovered close at 90.07 (gold horizontal line). Price has traded back to the median line and paused. If price pulls back, then watch for support near 90.58 (neckline). A break above the median line should lead to upside acceleration as per median line guidelines.
1/11 – DXY has reached a possible pausing level. The level in question is defined by the 200 period average on the 4 hour chart and the median line from the structure that originates at the 12/17 low. If price does pull back, then I’ll zoom in to identify possible support. If price zooms through this level then the top side of the median line becomes proposed support.
EURUSD 4 HOUR

EURUSD continues to slip and the next downside level of interest is the center line of the channel from the March low just above 1.1900. Resistance should be 1.2130 or so. Keep it simple!
1/12 – EURUSD has indeed bounced from near 1.2125 (low is 1.2132). The 61.8% retrace of the decline is 1.2266, which reinforces 1.2270 or so as resistance. 2021 VWAP is also 1.2266 (see below)! Notice that VWAP was resistance following the NFP spike last Friday. Bottom line, I’m on alert for a lower high near 1.2270.
AUDUSD 4 HOUR

AUDUSD is testing the median line from the Schiff fork off of the March low. This is a possible bounce level. In the event of a bounce, proposed resistance is former support at .7725. Downside focus remains the 25 line near .7520.
1/13 – AUDUSD resistance registered at the underside of a short term trendline. The breakdown level is .7640. A drop below would open up the 25 line within the Schiff fork off of the March low. A zoomed out chart is below. Notice how the 25 line was support (in November) and the 75 line was just resistance. The concept of symmetry at work!
USDCAD HOURLY

USDCAD sports a clean short term. Importantly, the construction of the fork is on a long term parallel (magenta line). Proposed support is the lower parallel and 61.8% retrace of the advance at 1.2689.
1/7 – USDCAD low on Wednesday was at a major parallel. The parallels are based on the line that connects the 2007 and 2011 lows. This is an example of ‘original slope’, which is often the most important angle to base parallels. For example, notice that the upper parallel nailed the 2019 high. I don’t see any near term setup for entry but strength above 1.2800 would break the series of lower lows since 12/21 and shift focus higher.


