Market Update – June 30
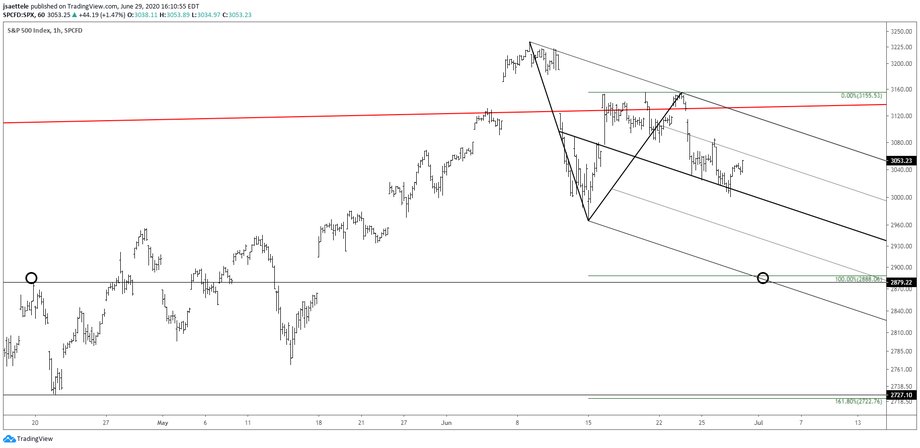
Trading the last few days in indices and FX is best described as a summer lull. That said, SPX focus remains on 2888. Price has respected the short term median line and 25 line the last few days. Expect acceleration lower in the median line breaks. I have no opinion on whether or not the 25 line continues to act as resistance. If it does not then the upper parallel should be watched for resistance near 3120.
6/24 – SPX initial downside focus is 2888, which is 2 legs down from the June high and a well-defined horizontal level. Notice how price churned around the red line on this chart for most of June before turning sharply lower today. That line extends off of the 2018 highs. It’s served as precise support and resistance over the last 2+ years. The daily is shown below and the monthly is 2 charts down. Extend the line back in time and you’ll see that the line crosses the 2000 high (exactly). It’s safe to say that this line is an ‘angle of influence’.
DXY 4 HOUR

Still no change to DXY analysis but I do want to share a few more observations. Seasonal tendencies are historically positive this week (see below), which fits with the idea of a rally to 98.40/60. Also, 2020 VWAP is 98.50, which is right in the middle of the cited zone for resistance (see 2 charts down).
6/25 – A flat unfolded in DXY from the 6/12 high. Strength from the 6/23 low is impulsive in DXY as well so expectations are for a corrective decline. Ideal support is 96.85-97.07 (probably towards the lower end of the zone). Upside focus is still 98.40/60.
DXY WEEKLY SEASONALITY

U.S. DOLLAR INDEX FUTURES DAILY

EURUSD 4 HOUR

The 75 line (red line) of the channel from the March low was resistance today. This line has been support and resistance throughout June. As such, I am bearish as long as long as price is below today’s low. The 61.8% retrace of today’s range is proposed resistance at 1.1261. Long upper wicks for the last 4 weeks on weekly candles at the 200 week average is also bearish (see below).
EURUSD WEEKLY

AUDUSD 4 HOUR

AUDUSD is testing the line off of the 6/15 and 6/21 lows. Weakness below would warrant a short position with focus on .6680s and maybe .6570. Until price breaks lower however, strength is possible to complete the final leg of a triangle from the 6/15 low. If this happens, then proposed resistance is .6915 (high volume level from last week).
6/25 – An extremely quiet day in AUDUSD. In fact, today’s range was the smallest since 5/25. The previous smallest range was on 2/25 (what is it with the 25th day of the month?!). .6915/25 is the proposed resistance zone. The bottom of the zone is the high volume level from Tuesday’s Asian session (Navarro’s ‘trade deal is done’ talk).
USDCAD 4 HOUR

USDCAD traded 1.3616 on Friday before making an inside day today. Proposed resistance is still slightly higher…about 1.3740. I’m on alert for a reversal near that level. However, if price breaks above then I’d be willing to go with strength because that would represent a move through a short term bullish median line. Focus would be on 1.3890-1.3920.
6/23 – With USDCAD low right on the 6/9 high, it’s worth a shot on the long side now in USDCAD (rather than waiting for 1.3450s). The center line of the channel from the May high, which was support several times in May, is proposed support for entry near 1.3510. Upside focus is the upper parallel, which is mid-1.3700s over the next few days.


