Market Update 12/29 – USD at Resistance into 2022
DXY DAILY

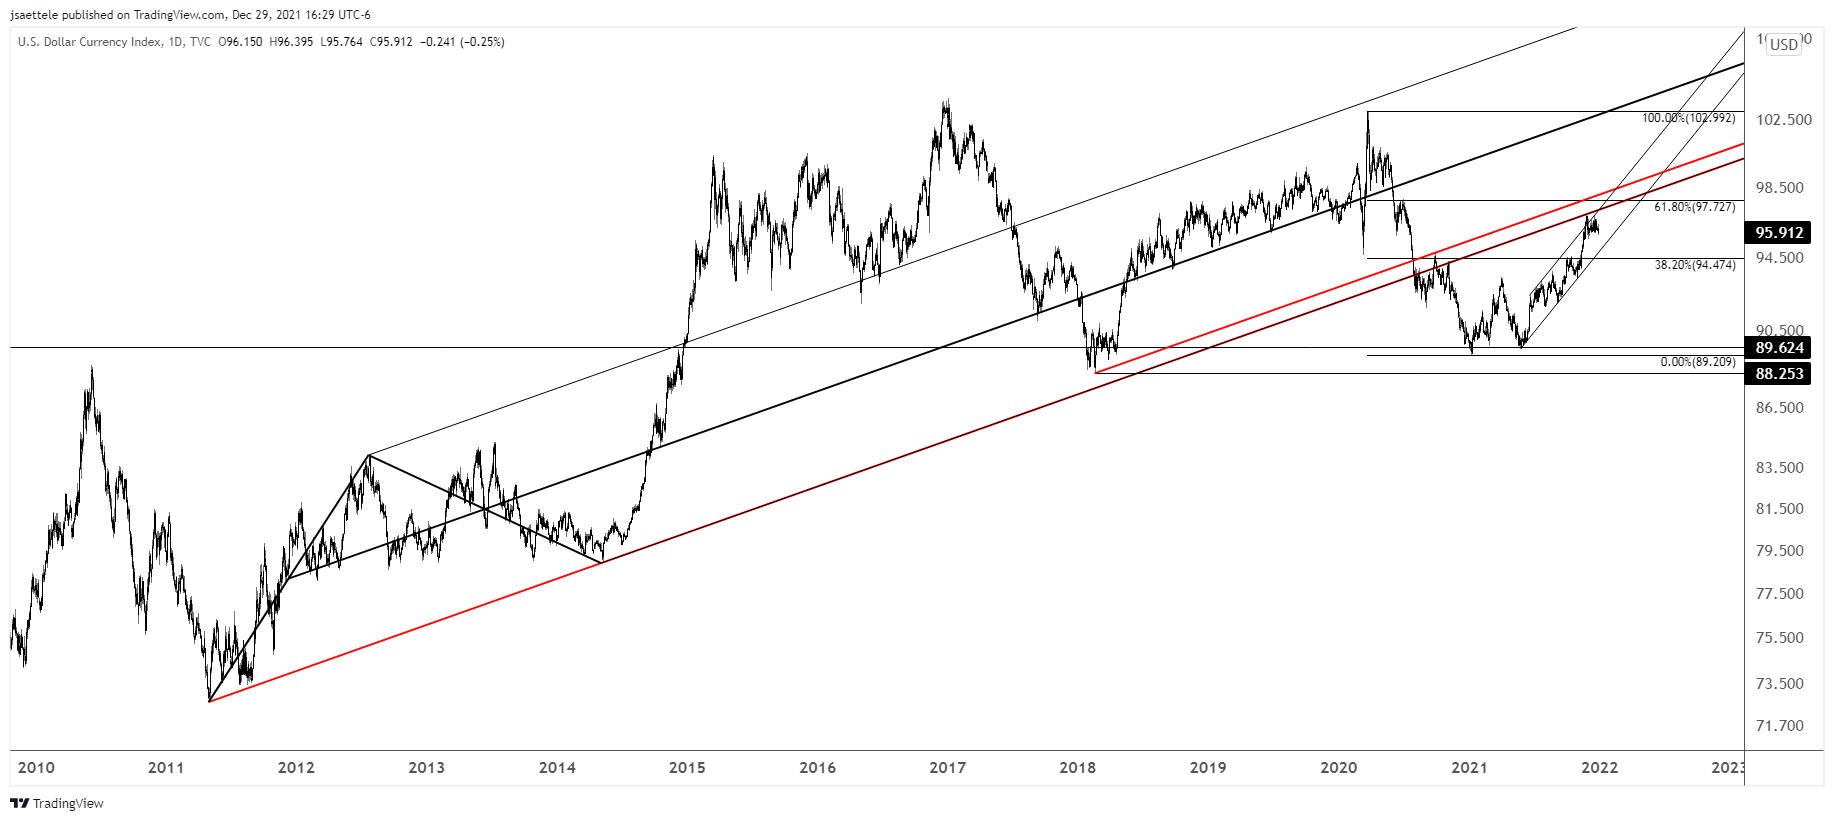
This is the last update of 2021. A new calendar year is significant and those details will be addressed next week. The charts in this post highlight why I’m heading into 2022 with a USD bearish mindset. The chart above is a starting point insofar as making a USD bearish argument although the big picture ‘textbook’ trigger doesn’t occur until a break of the channel near 95. Until then, respect potential for strength into the 61.8% retrace of the decline from March 2020 at 97.73.
12/14 – The USD remains stubbornly up to flat. The psychological situation reminds me of early in the year when the USD was stubbornly lower for longer despite multiple reversal signals. Of course, price eventually resolved higher and now I want to go the other way! The underside of the former trendline support was reached 3 weeks ago and nothing has happened since. The situation should resolve in the next few days with Fed, ECB, BoE, and BoJ scheduled. We’re at resistance therefore I’m ‘thinking’ lower. The chart of daily closes below is a thing of beauty with respect to confluence resistance.
EURUSD DAILY
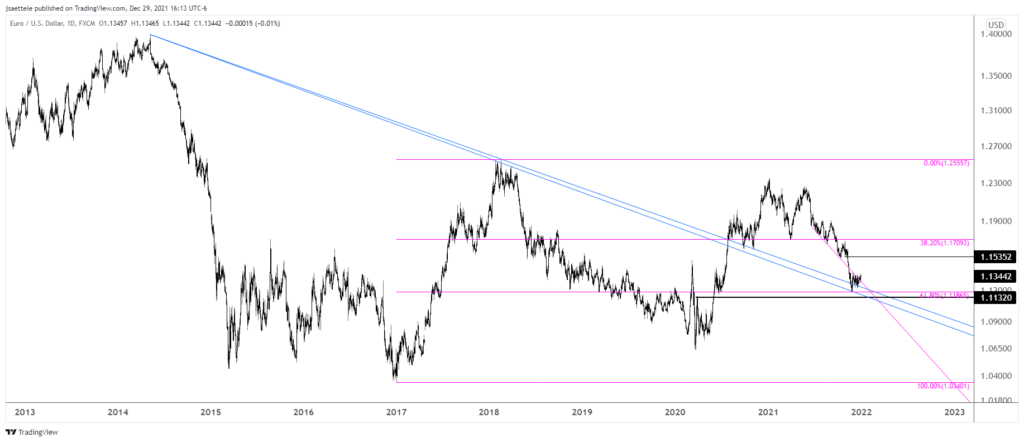
One month ago, EURUSD bottomed at 1.1186. That price is the 61.8% retrace of the rally from 2017 (first trading day of 2017). The top side of the trendline from 2014 has also provided support. Action since the November low isn’t clear and could compose a correction before another thrust lower. If that happens then 1.1132 (close of the March low COVID week) is proposed support. That isn’t my base case however and I’m looking for upside resolution from the December range.
12/27 – The last week of the year is often the quietest week of the year. That said, I want to stay abreast of what is happening so I’ll have updates this week.
EURUSD is trading above the bullish ‘trigger line’ but the action is clearly subdued given the last week of the year action. I am bullish EURUSD but it doesn’t make sense to do anything right now.
GBPUSD DAILY
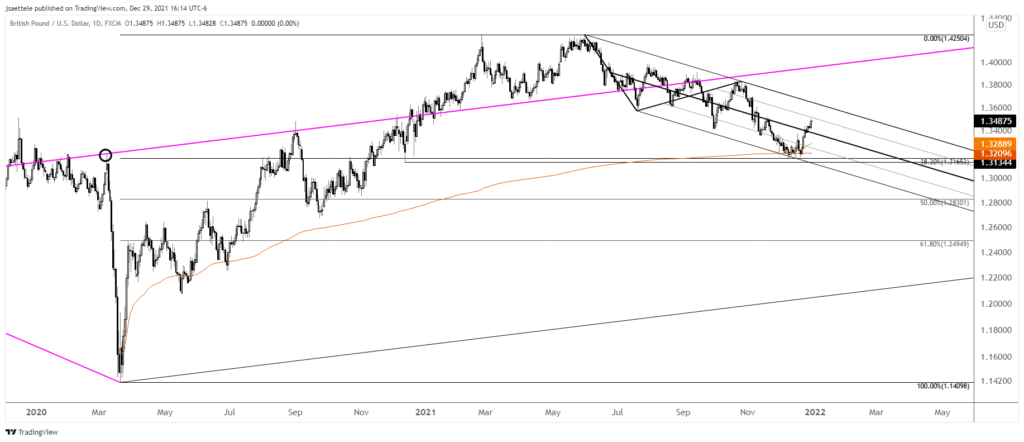
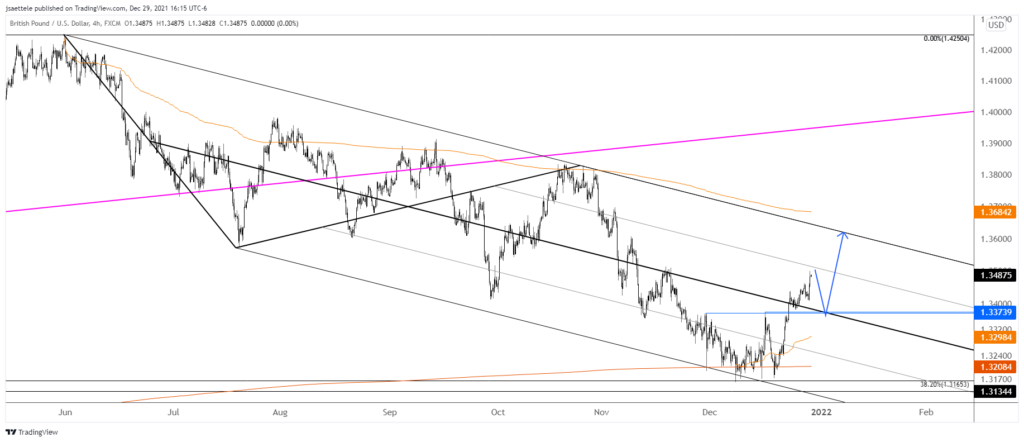
GBPUSD has a well-defined floor (see text below) heading into 2022. Early in the new year, focus on support near 1.3370 with resistance near 1.3600 (see below chart). A break above the channel opens up 1.4000.
12/20 – Cable remains above the high, although barely. I continue to ‘think’ higher in GBPUSD given the well-defined price level that price is hovering above. Again, this is VWAP from the March 2020 low and channel support. There is also the high from March 2020 and the 38.2% retrace of the rally from March 2020. Finally, there is RSI divergence on the 4 hour chart. Magenta dots in the chart below show divergent readings over the past year.
GBPUSD 4 HOUR
USDCHF DAILY
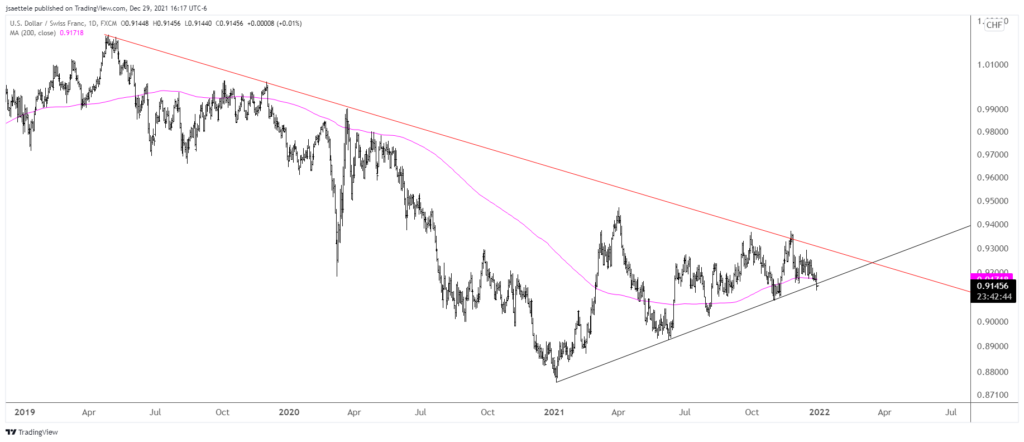
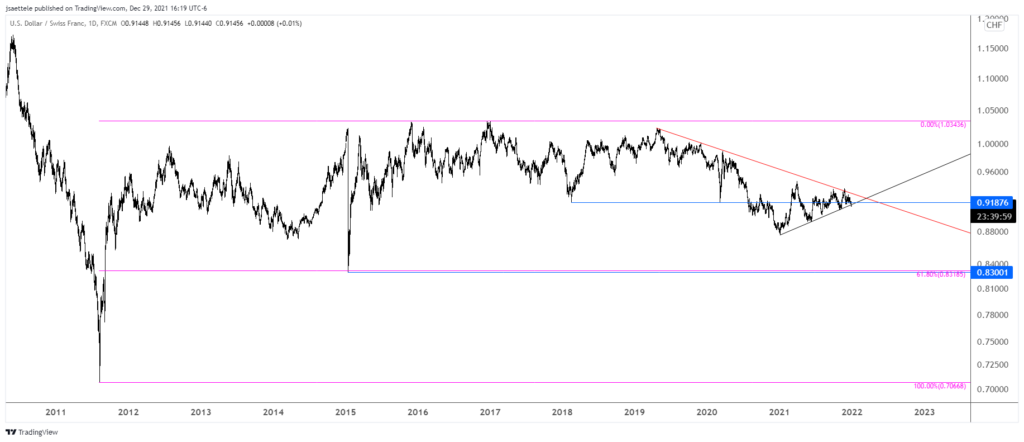
Pay attention to USDCHF. Most do not. Price is attempting to break the year long trendline (low for 2021 was 1/6). This attempt comes following the failure at a 2+ year trendline. In the event of a breakdown, the objective is .8300ish (see below).
USDCHF DAILY
USDJPY DAILY
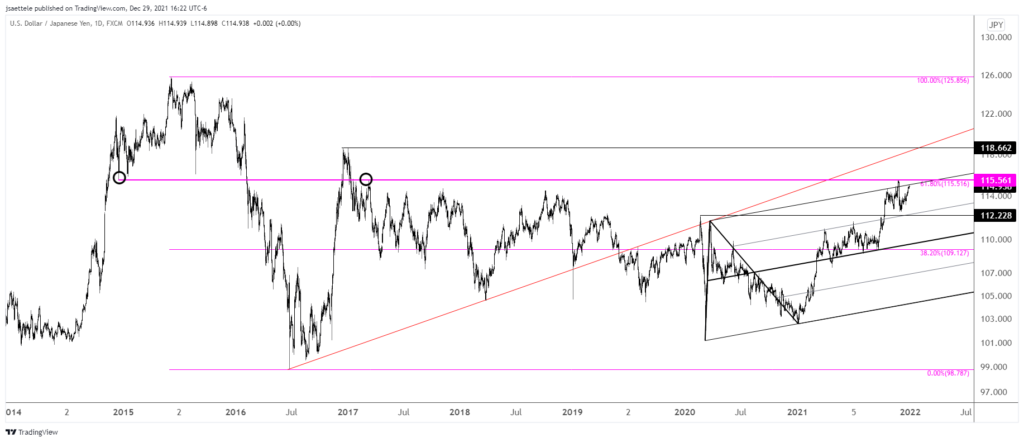
No change to the comments from a few days ago.
12/27 – I’m wondering if USDJPY is going for a re-test and failure of the November high. Remember, the 61.8% retrace of the decline from 2015 is 115.52. Also, the rally from March 2020 channels perfectly.
AUDUSD DAILY
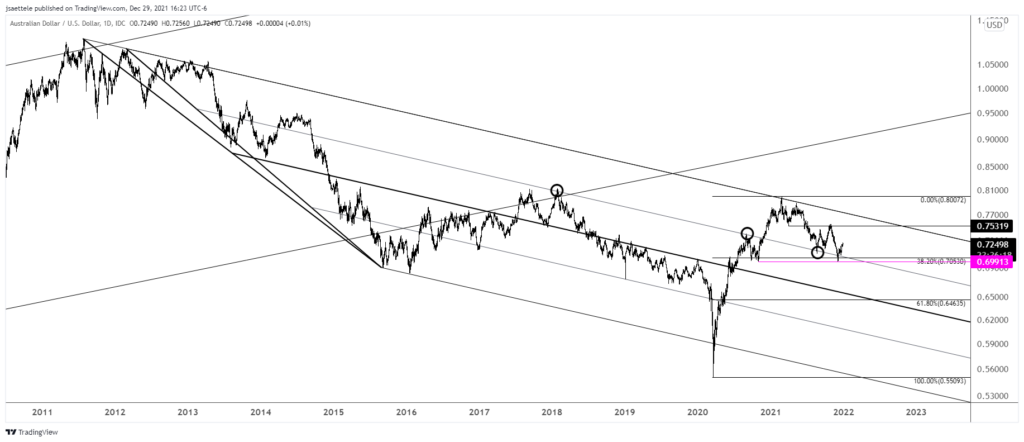
No change to the comments from a few days ago.
12/27 – AUDUSD continues to make progress within what I believe is a new bullish sequence. As such, focus is on identifying support to buy. .7170 sticks out as the ideal level. This has been an important horizontal level since the September low. The price intersects short term channel support at the end of this week (and year). Maybe we get a big buying opportunity right at the beginning of 2022! .7290 or so is still proposed resistance for a pullback.
USDCAD DAILY
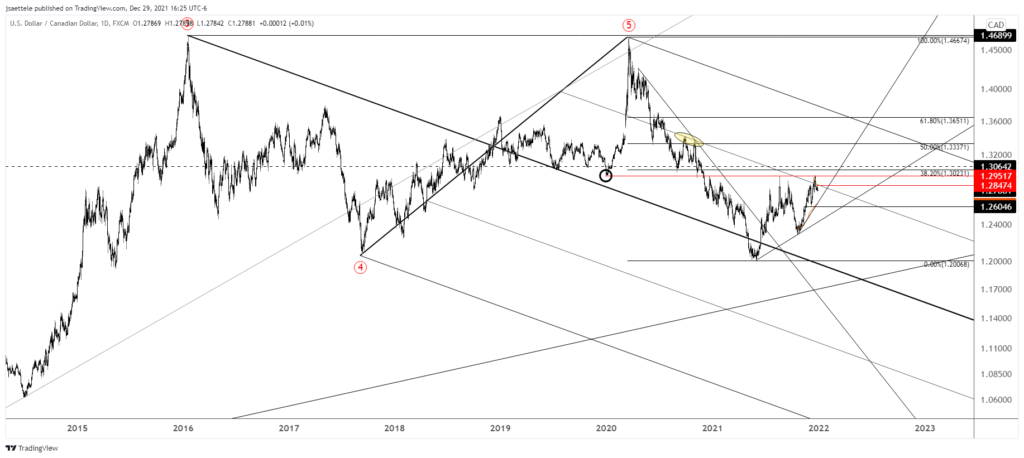
No change to the comments from a few days ago.
12/27 – Last week, USDCAD finally spiked through 1.2952 and reversed. In fact, the level is also defined by the December 2019 low. There is also the 25 line, which was resistance for several important highs in 2020. In other words, this is a great spot for a big top. Near term focus for resistance is 1.2850 (see below).

