Market Update 1/19 – Bearish USDCHF Setup
SPX HOURLY

The SPX bounced was turned away at the underside of the line off of the December and early January lows and price broke the bearish median line. This leaves the index in an extremely dangerous spot as there is now risk of accelerated weakness towards the 75 line near 4450 and eventually the lower parallel near 4330. The median line is now proposed resistance near 4555.
1/18 – SPX rolled over from noted resistance and definitively broke the trendline from the October low. The underside of that trendline (magenta line) is now resistance near 4665 if reached. Price is again approaching the median line of the bearish fork. The median line nailed the 1/10 low. If this line is broken then expect accelerated weakness towards the lower parallel which isn’t until 4350 or so.
DJIA WEEKLY

The Schiff fork from the 2009 low in ‘the Dow’ is a thing of beauty. The only time that price traded outside of the structure was in early 2020 (COVID crash). Even then, the low registered at the full extension of the channel. Not withstanding a period of back/fill, the major level to pay attention to now is the median line near 33000. A zoomed in view is below.
DJIA DAILY

NIKKEI 225 DAILY

The Nikkei may be on the verge of confirming a double top with the February and September highs. If the pattern confirms, then the measured objective is 23492, which is just under the 38.2% retrace of the rally from March 2020 at 24140. So, let’s just call the target zone 23492-24140.
TLT DAILY

Simply, this looks like a good place for a TLT bounce. That said, the trend is lower until proven otherwise so pay attention to the underside of former trendline support near 146.10 for resistance.
USDCHF DAILY

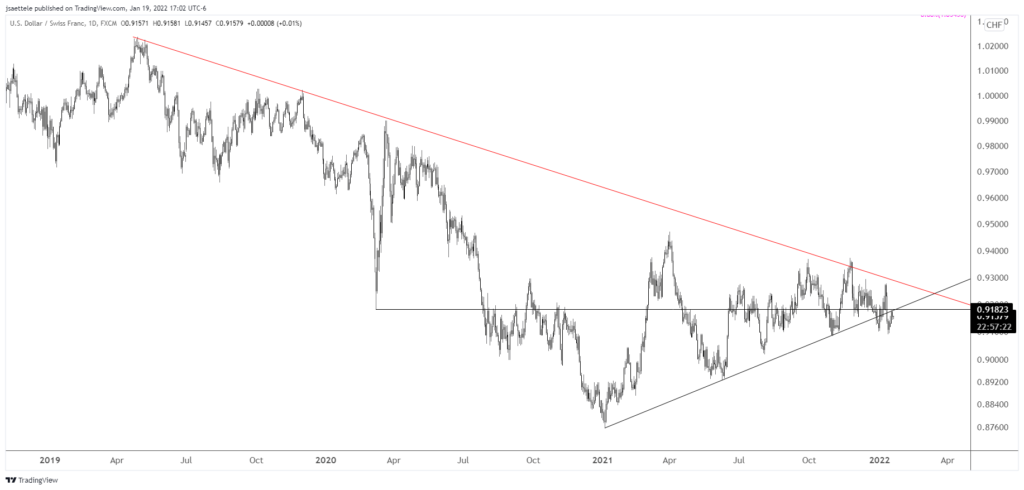
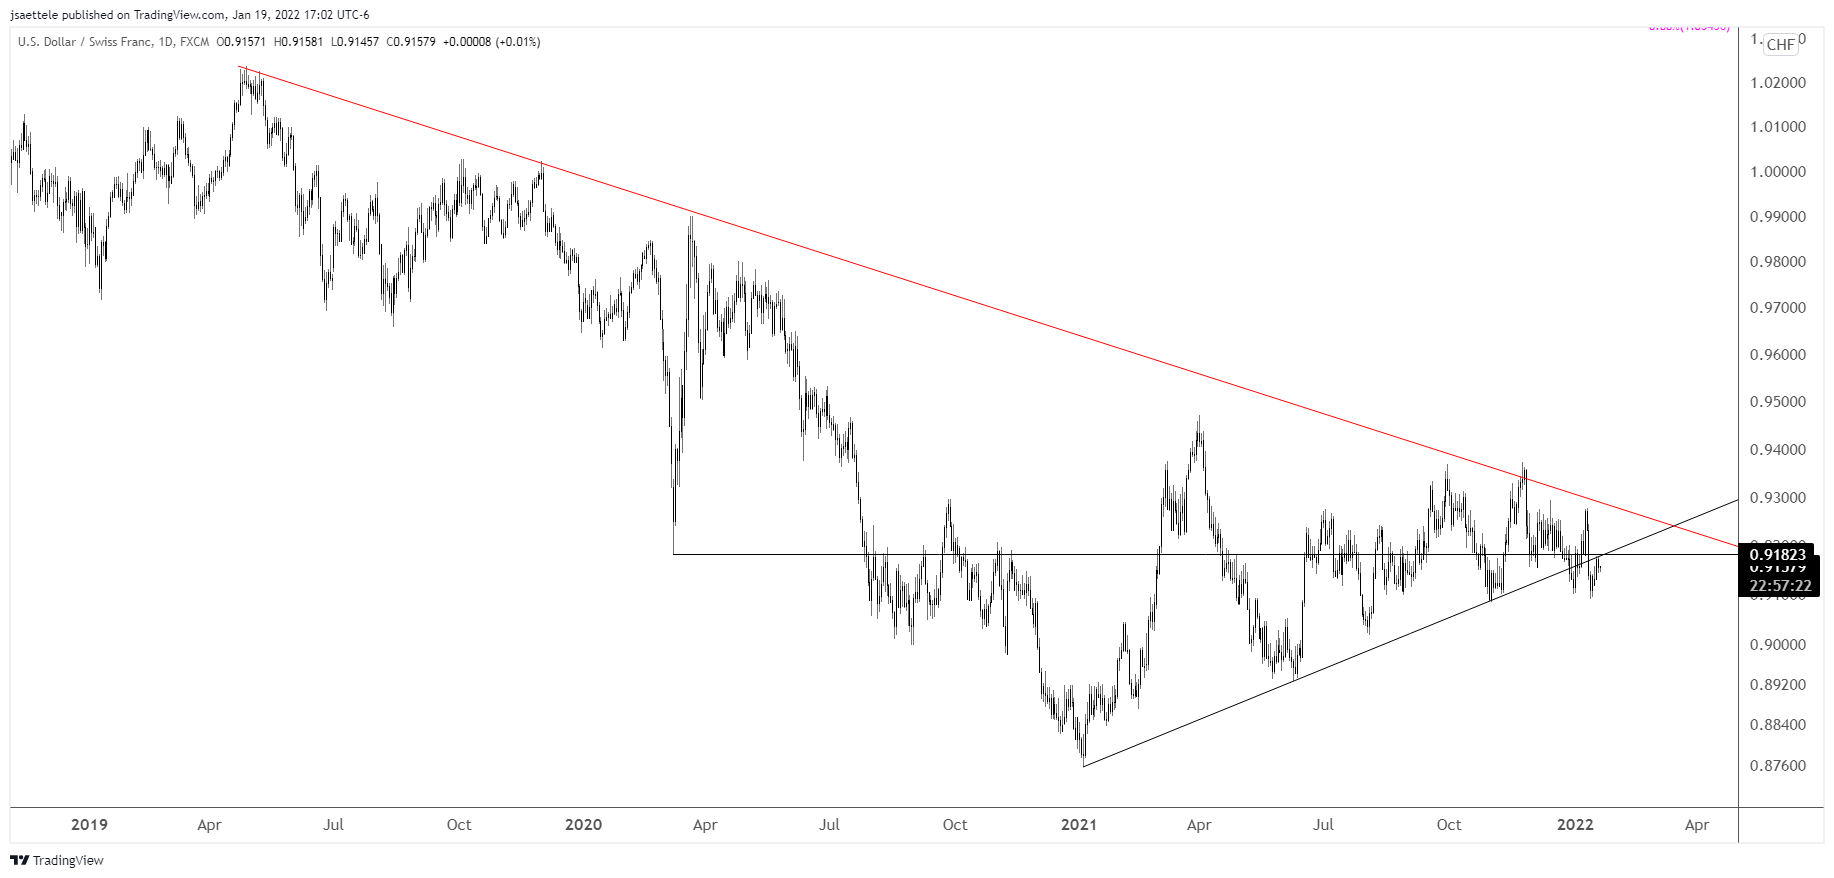
Is USDCHF about to get destroyed? After failing at a 2+ year trendline in late 2021, price has broken a year long trendline and now re-tested the underside of the line the last 2 weeks. This chart is extremely bearish.
12/29 – Pay attention to USDCHF. Most do not. Price is attempting to break the year long trendline (low for 2021 was 1/6). This attempt comes following the failure at a 2+ year trendline. In the event of a breakdown, the objective is .8300ish (see below).
USDCAD 4 HOUR

USDCAD has been churning around the median line all week but reversed higher today from the trendline that originates at the June low (again). I am looking for a run at 1.2630. This is the underside of the neckline and VWAP from the October low, which was previously support.
1/13 – USDCAD low today was 1.2453 (right on the trendline). Given the response at the trendline, I favor a bounce into at least 1.2550s (median line) and maybe 1.2630s. A bounce into the latter level would present an ideal short into the underside of the neckline (bold red line).
CADJPY 4 HOUR

CADJPY action since the start of the year may be a topping process (kind of an ugly head and shoulders). Weakness below 91.20 would trigger a bearish bias for me. The level has been key since October and is also 2022 VWAP (magenta line). Immediate focus would be 90.54.


