Market Update 11/11 – Trade Setup in Gold
SPOT GOLD 4 HOUR
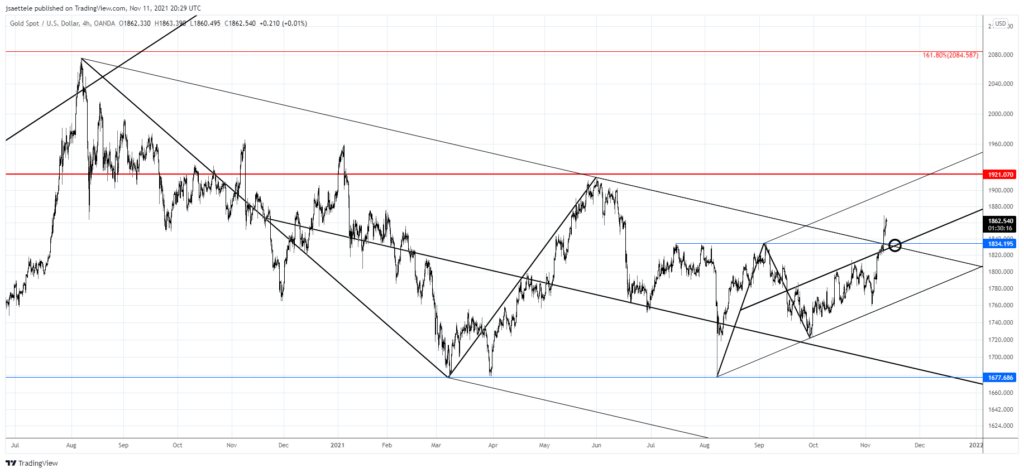
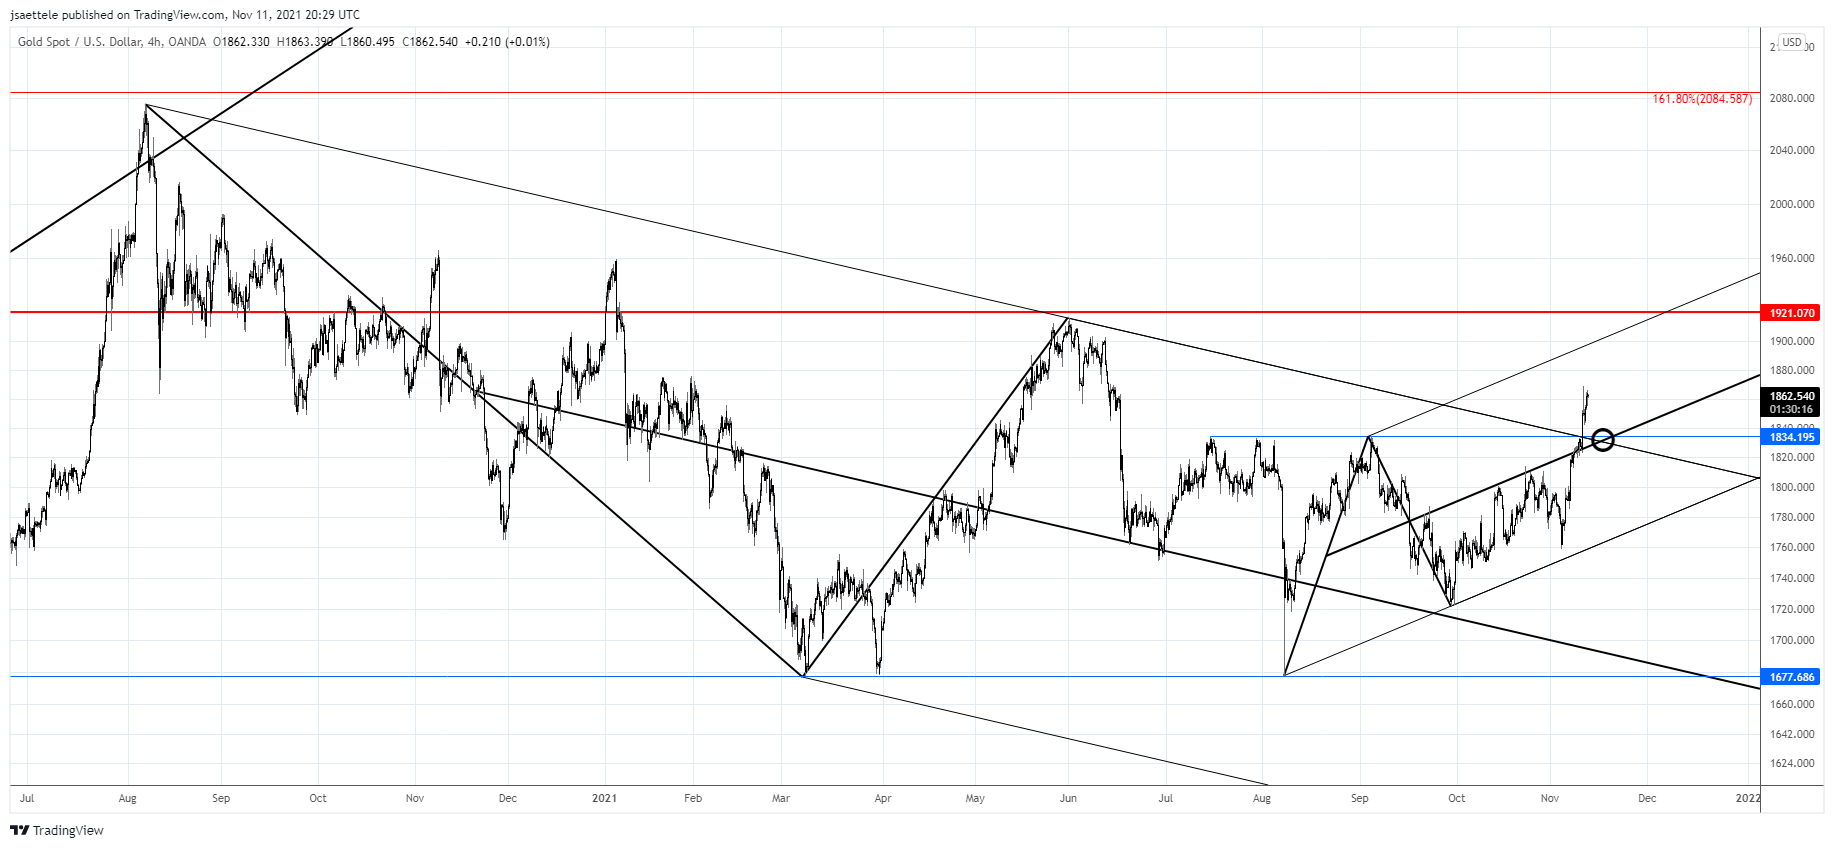
The cleanest setup from my vantage point at the moment is in gold. Price has broken out (remember 1834 was possible resistance…it didn’t do anything so it’s support) and 1834 is proposed support. Former resistance is reinforced by the top side of the line off of the 2020 and May highs along with the center line of the short term bullish channel (which was formerly resistance). Upside focus is the May high at 1916.
DXY WEEKLY SEASONALITY
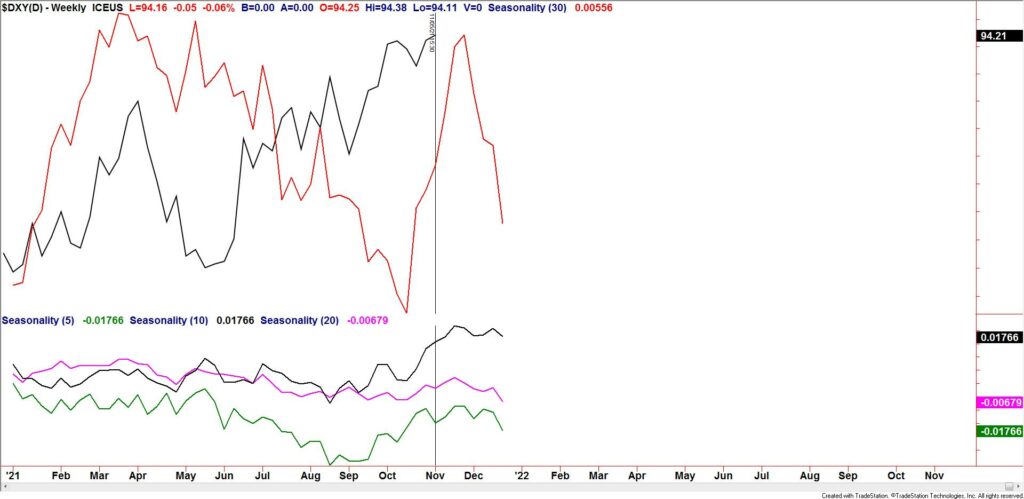
DXY seasonals remain firm through November and then flip to bearish. In fact, December is historically one of the worst months for the USD. I probably should have paid more attention to seasonal tendencies before this USD move!
EURUSD DAILY
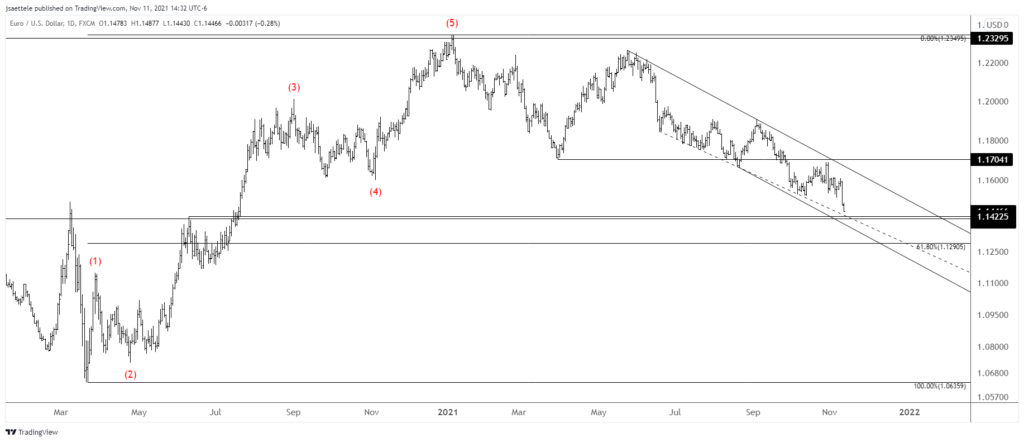
EURUSD could bounce near 1.1423. This is the June 2020 high and line that extends off of lows since June 2021. I look at this as nothing more than a possible bounce level. The next big level isn’t until the 61.8% retrace of the rally from March 2020 at 1.1291.
USDSEK DAILY
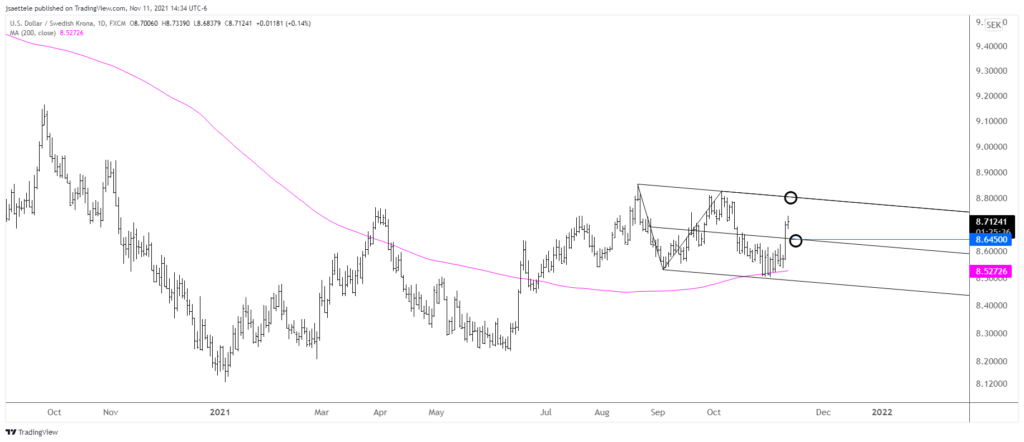
Less traded pairs such as USDCHF and USDSEK have been ‘the tell’ insofar as USD strength is concerned. We looked at USDCHF yesterday. For USDSEK, pay attention to 8.6450 for support now. The big breakout test is about 8.80.
11/4 – I have not been ‘in tune’ with USD moves for the better part of the last month. During periods of uncertainty, I find it helpful to go back to the basics. USDSEK is often a ‘tell’ for general USD trends and pivots. Here are several objective technical observations;
USDSEK is holding the 200 day midpoint (similar to the 200 day average)…this is bullish.
The decline from the 8/20 high is in 2 equal legs…this is characteristics of a corrective decline within a larger advance…bullish
Daily RSI registered ‘overbought’ readings at price highs over the last year and RSI readings at price lows have been above 30…this is also bullish.
In summary, the weight of evidence is USDSEK bullish and therefore generally USD bullish (notably against European FX). At least that’s where my mind is at the moment.
GBPUSD DAILY
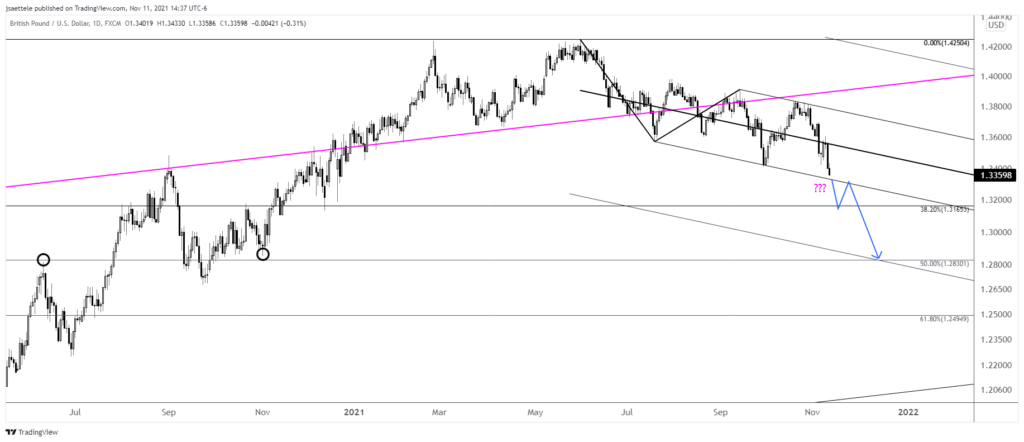
GBPUSD looks like death. That said, price could bounce from the lower parallel near 1.3325. A break below the parallel however would leave Cable in extremely dangerous territory and present a big bearish opportunity. If price breaks below, then the underside of the line becomes proposed resistance and the target would be 1.2830. I’ve outlined a possible path.
USDCAD DAILY
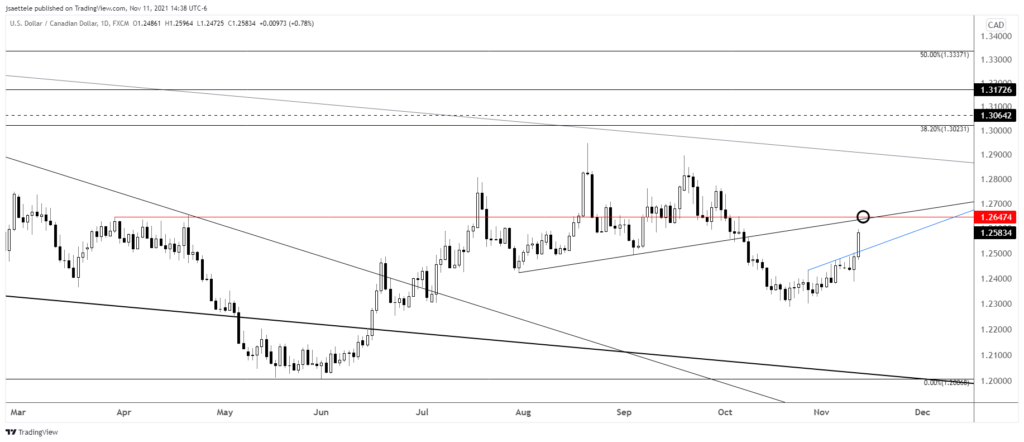
The previously discussed USDCAD bearish pattern is obviously no longer valid. From a pattern perspective, I’m not sure what’s going on right now but pay attention to 1.2650 or so for possible resistance. The top side of the blue line should provide support near 1.2520 if USDCAD is bullish on a swing basis.

