Market Update 6/14 – BTCUSD Nearing Resistance
Market Update 6/10 – USDJPY about to Break Down?
June 11, 2021Market Update 6/15 – Copper Breakdown
June 16, 2021

BTCUSD 4 HOUR
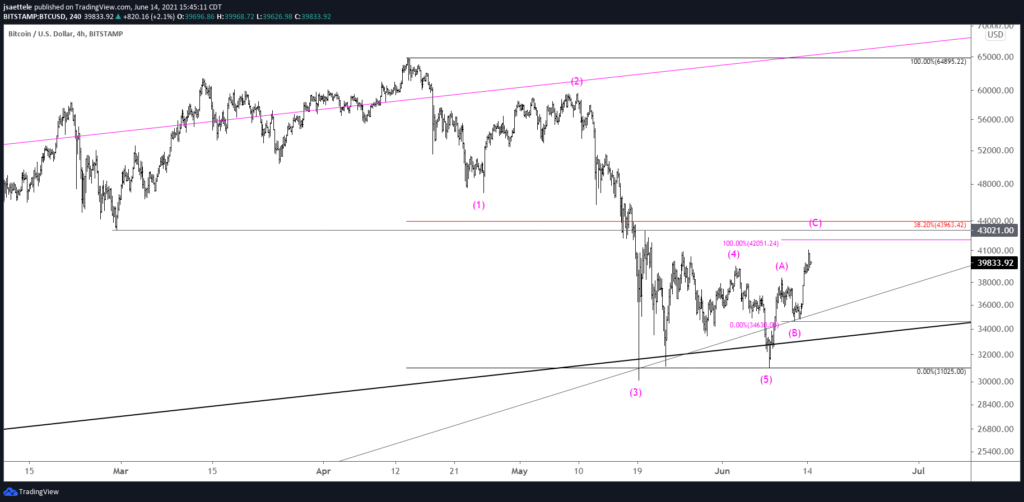
BTCUSD is still playing out in perfect Elliott form as price nears the noted zone of 42000-44000. The rally would consist of 2 equal legs at 42451 and the 38.2% retrace is 43963 (don’t forget about last week’s observation regarding 38.2% retraces in BTCUSD after plunges from record highs). Bottom line, we’re looking for the next high soon.
6/10 – BTCUSD is following the script. The rally from this week’s low is in 5 waves which suggests a small pullback before another leg up. Proposed support is 33860. 42000-44000 remains proposed resistance.
SPOT GOLD DAILY
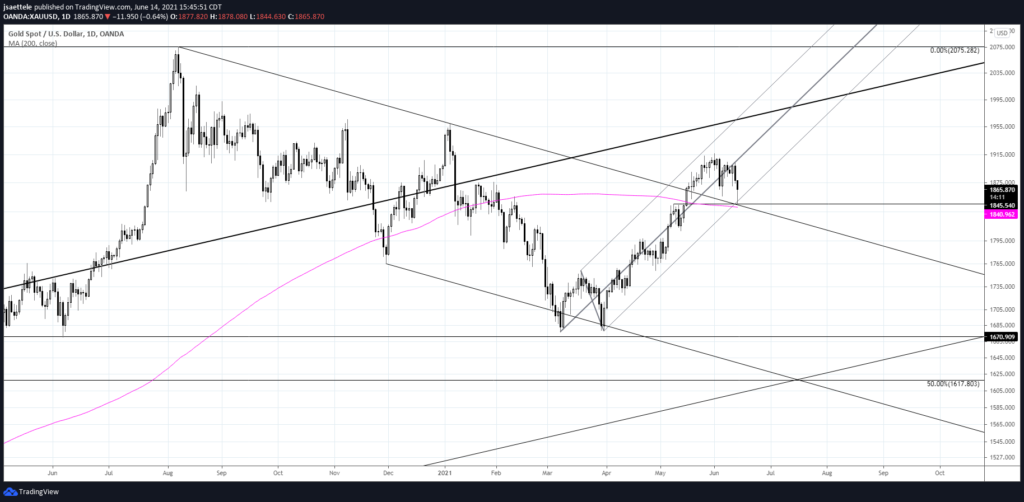
Gold low today nailed support from the 200 day average and former trendline resistance. Gold is constructive again and risk is against today’s low. That simple.
USDOLLAR 4 HOUR
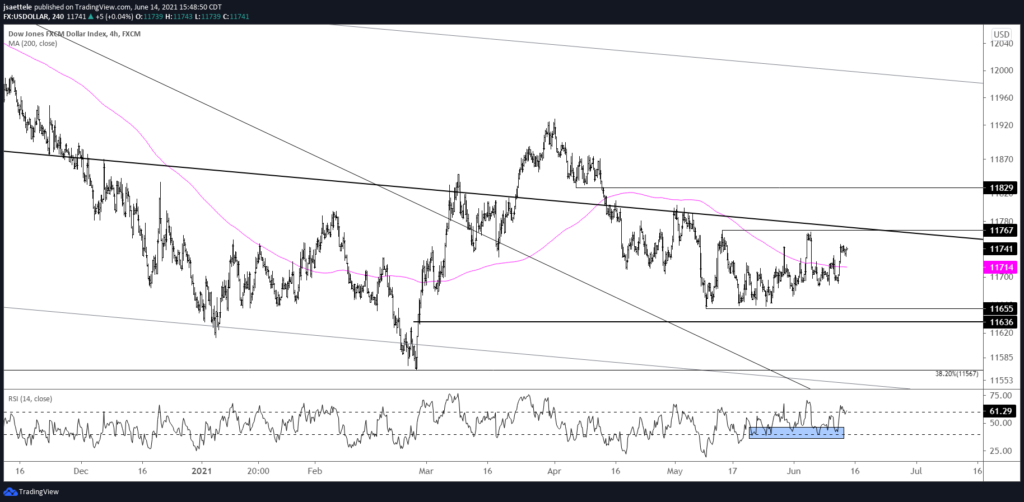
USDOLLAR is nearing (again!) the median line from the structure that originates at the 2017 high. A move above the line would represent an important behavior change and signal (finally!?) that price is about to burst higher from the base that began in January. Notice RSI on the 4 hour chart. 40 has been ‘support’ for the indicator and price tops have occurred when the indicator is ‘overbought’. This puts USDOLLAR in a ‘positive RSI profile’ on this time frame.
6/7 – USDOLLAR traded into the upside level of interest and turned sharply lower. Most of the rally from the May low has been retraced. Even so, nothing regarding the idea of a massive consolidation bottom since January has changed. 11655 remains proposed support. COT positioning is stretched to the downside and indicates elevated reversal risk (see below).
DXY 4 HOUR
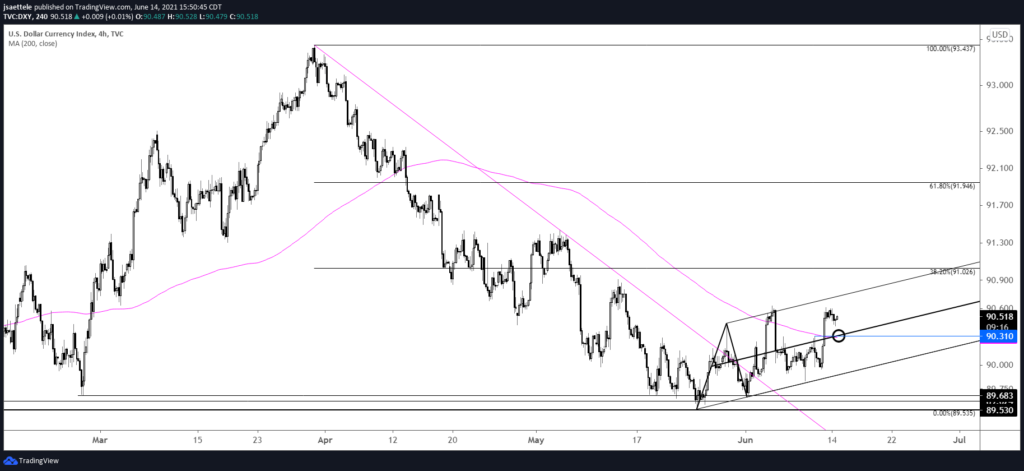
If DXY has finally turned the corner, then 90.30 should provide support now. The equivalent level for EURUSD is 1.2150. Also, a rally through the top of the channel near 90.70 would trigger a ‘slingshot’ setup.
GBPUSD 4 HOUR
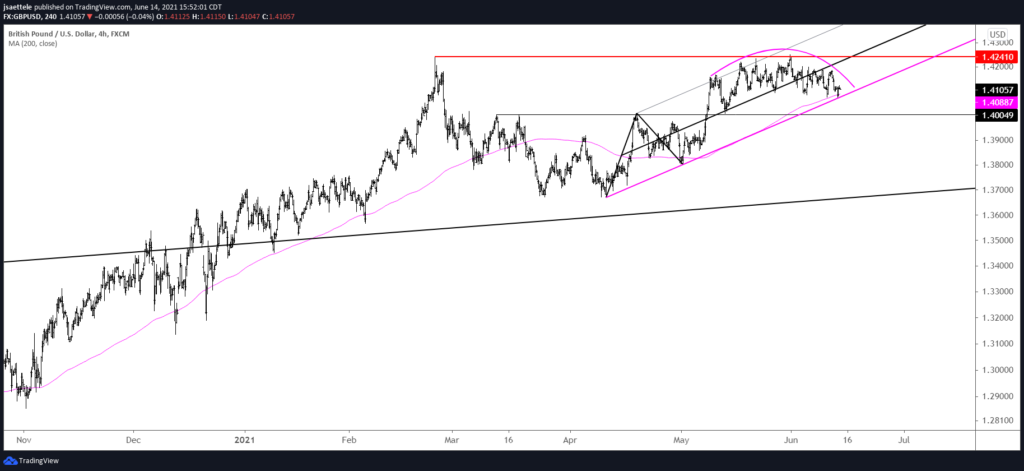
GBPUSD dropped into and held channel support today. However, action since mid-May has the look of a top (call it a head and shoulders if you want…it just has the look of a top) so if price breaks then watch the underside of the channel line for resistance. In the event of a break, the well-defined 1.4000 is a bounce level.
6/9 – Daily Bollinger Band width for GBPUSD is extremely low. The reading is towards the lower end of its historical range. Readings this low are shown with magenta dots. Although BB width is not a directional indicator, extremely low readings have occurred before sharp declines. This makes sense since extreme complacency (as indicated by narrow Bollinger Bands) occurs at USD lows.
USDCAD 4 HOUR
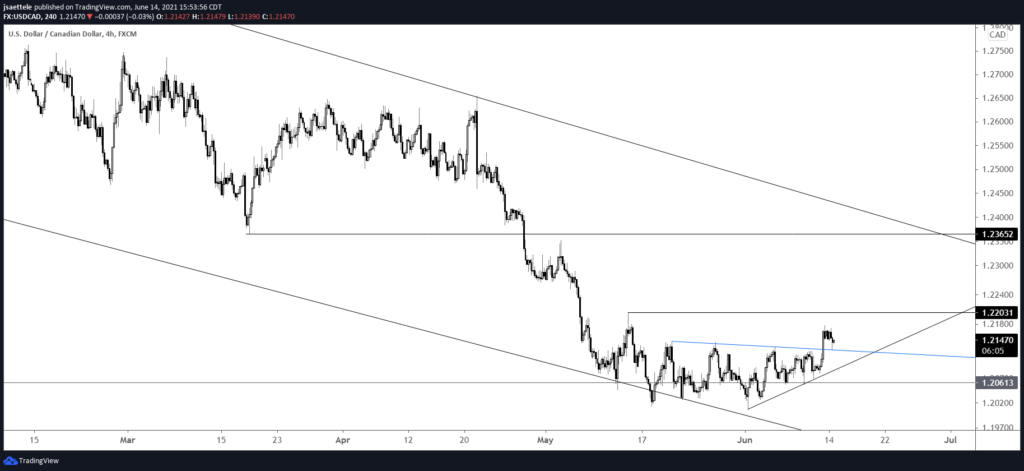
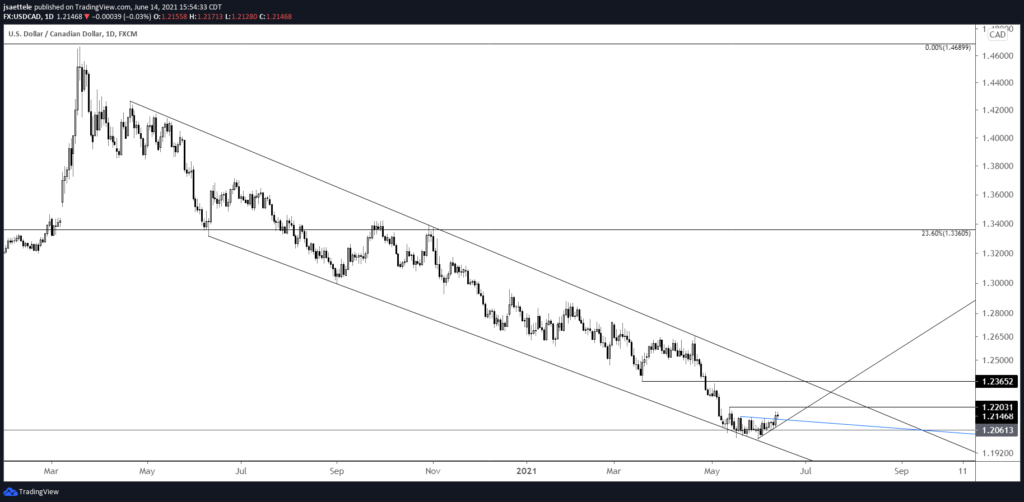
USDCAD has completed a bottoming pattern. Upside focus is the trendline from April 2020, which is in line with the March low at 1.2365 at the end of the month (see daily chart below). I’m bullish now as price is testing a short term neckline but 1.2100 is proposed support if the current level fails to hold.
6/8 – USDCAD has flat-lined for about a month in what could be a low volatility base from 6 year lows. The bullish trigger is 1.2144, in which case the near term objective would be 1.2275 followed by trendline resistance near 1.2400/50. BoC is tomorrow. I’ll reassess the situation after the event and plot an entry if price action dictates.
USDCAD DAILY
USDTRY 4 HOUR
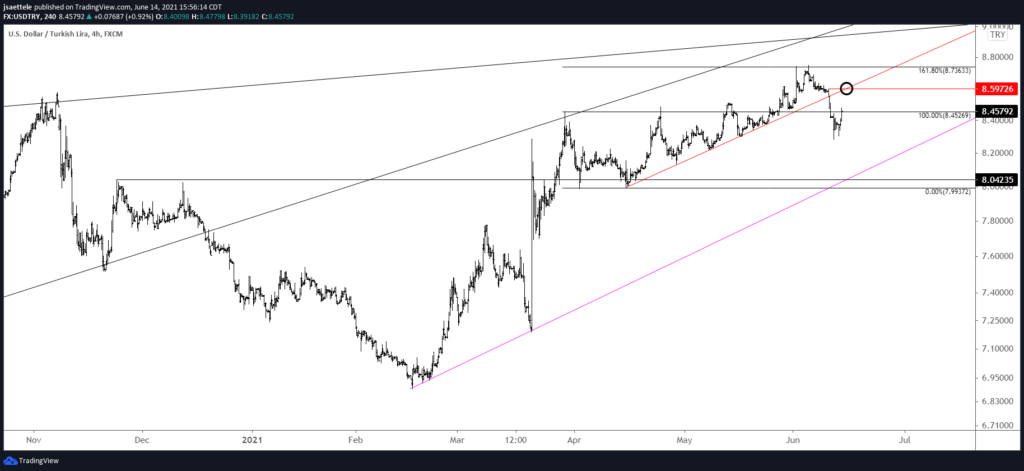
Focus for USDTRY resistance remains the underside of the trendline from the 4/15 low. That is near 8.60. I’m looking for that level to proide resistance and for price to eventually test the line off of the February and March lows (magenta line).
6/10 – USDTRY dumped today after breaking a short term trendline. Price is testing the 200 period average on the 4 hour chart. After the November top, price tested this average before trading back to the 50 period average and then resuming lower. Something similar here? If that happens now, then resistance should be near 8.5680. Another entry option is for price to break below the 200 period average and then for that average to provide resistance. The opposite happened (price broke above the average and the average was then support) last August and in March.
