Market Update 3/7 – EURUSD at an Important Trendline
Guide to trading ALGO with leverage
March 5, 2022Market Update 3/8 – Euro Reversal Signal
March 9, 2022

DXY WEEKLY SEASONALITY
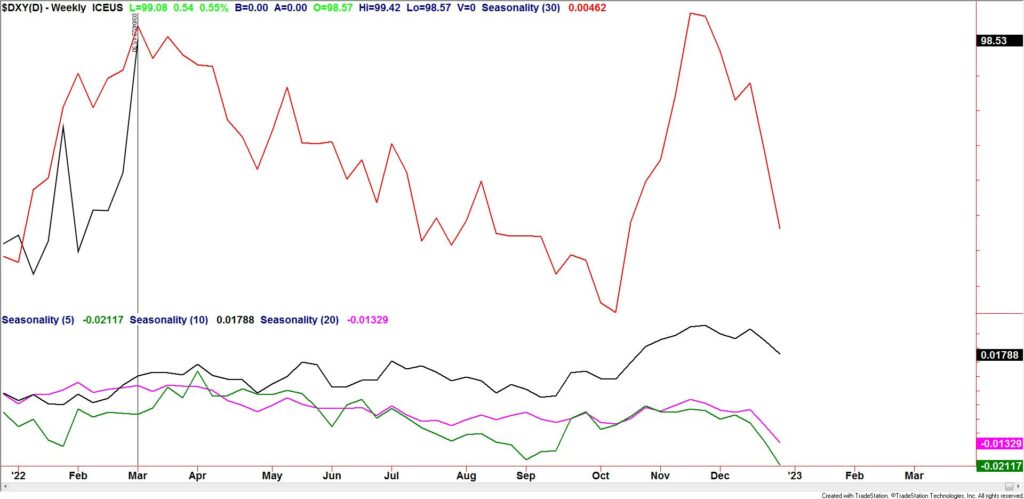
The USD has been on a tear but long term seasonal tendencies do turn down this week. Obviously, there is no price ‘reason’ that suggests trading from the short side yet.
EURUSD WEEKLY
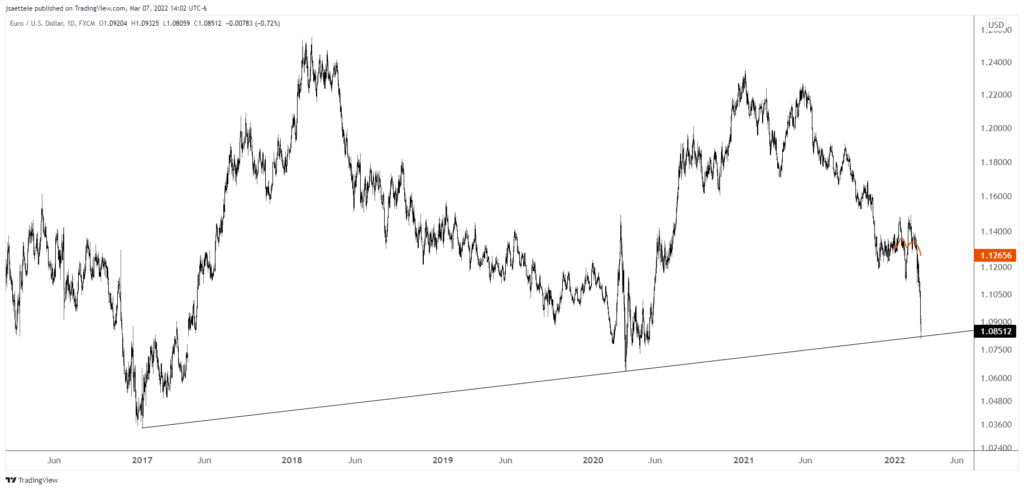
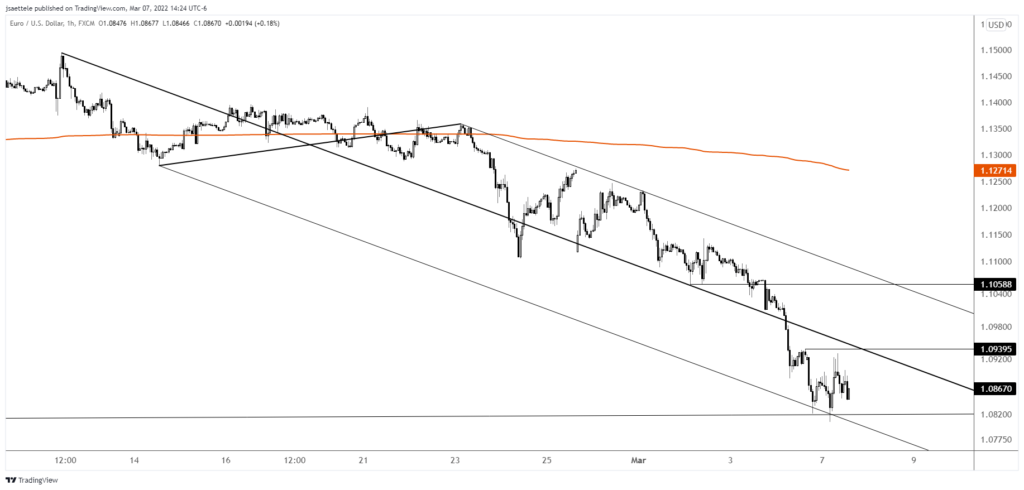
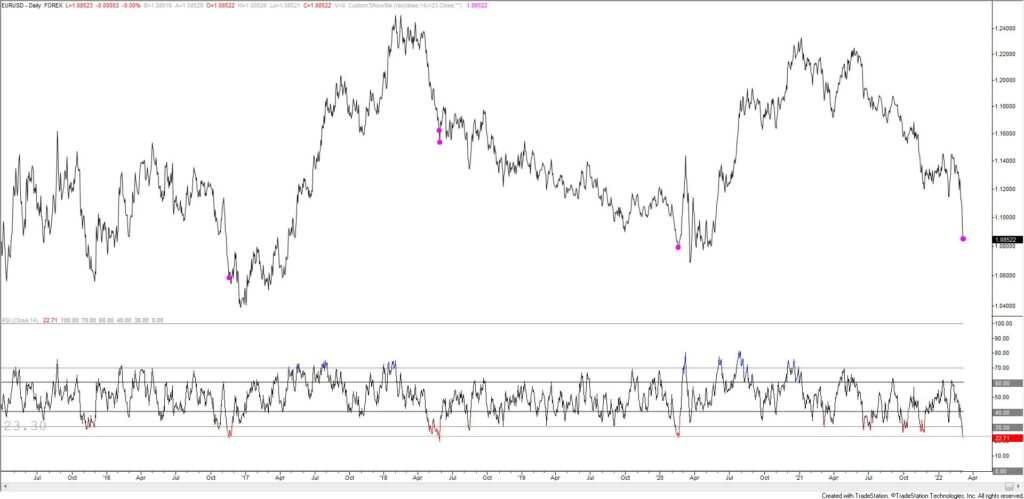
EURUSD has cut through everything that I thought would provide support and price has now reached the line off of the 2017 and 2020 lows. If this doesn’t hold then I guess there is nothing until the March 2020 low at 1.0636. Near term (see below), price has responded to the lower parallel of the fork from the 2/10 high. The important test on the upside (if price bounces of course) is about 1.1060. Finally, daily RSI is below 23. Previous instances over the last 5 years are shown 2 charts down.
EURUSD HOURLY
EURUSD DAILY
AUDUSD DAILY
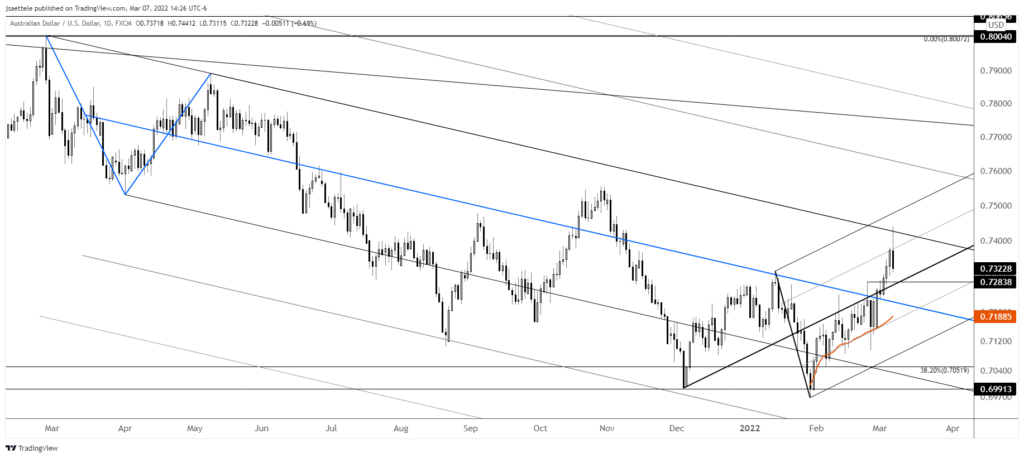
AUDUSD reached .7420s (trendline from 2021 highs) and reversed sharply lower today. The action probably caps Aussie for a while. .7280s is a possible bounce level although bigger support isn’t until the channel center line (blue line…which was former resistance) near .7220. Proposed resistance is now .7375.
3/2 – AUDUSD broke above the median line today so longs are in play. The top side of the median line is proposed support now (formerly resistance) near .7265. This is also the year and month opening prices. One benefit to trading with median lines are tight stops. That’s especially useful in this instance given the proximity of the January high and 200 day average as possible resistance. Upside focus is .7370 followed by .7420s.
NZDUSD DAILY
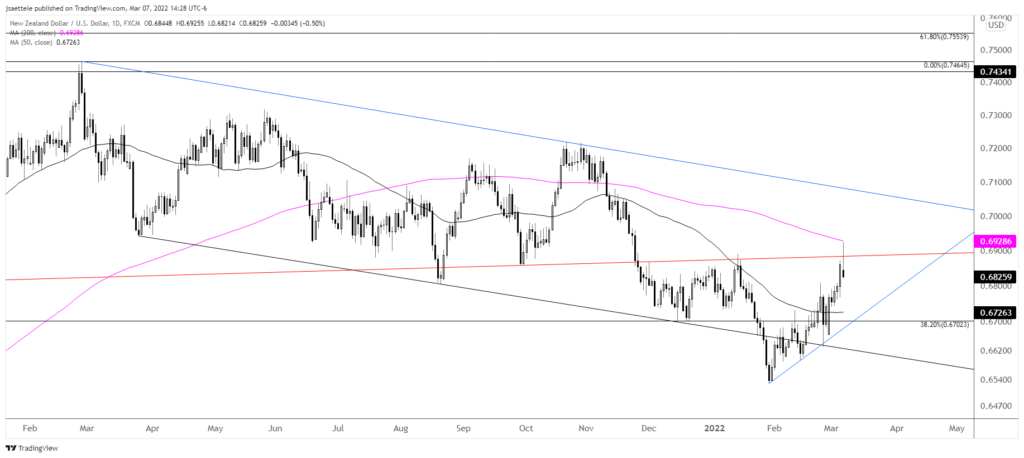
Kiwi reversed from the line that connects the December 2019 and September 2020 highs. This line was support in August/September 2021 and resistance in January. It’s clearly important. The 200 day average is also just above today’s high. Focus is lower towards the trendline from the low near .6700. Proposed resistance is .6850/70.
USDCAD DAILY
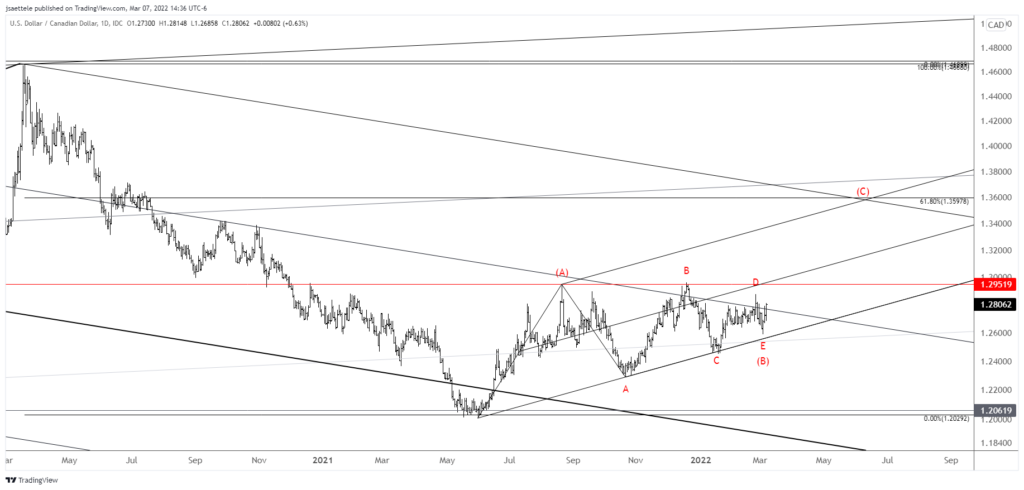
I’m wondering if USDCAD completed a B wave triangle last week within an A-B-C pattern from the 2021 low. Under this scenario, a C wave higher is about to begin. 1.3600 is a well-defined target. 1.2950 is a big test of course though. Watch for support near 1.2735/50.
