
Market Update 12/22 – EURUSD Testing Trigger Line
CRUDE OIL 4 HOUR

Focus for crude is squarely on 77. This is now also where the rally would consist of 2 equal legs up.
12/9 – Crude did indeed stretch into 73 (high so far is 73.34) before rolling over. 69.20s is well-defined for support now. This is the 50 period average on the 4 hour chart, which has been support/resistance for months. It’s also the 12/3 high. 75-77 is in line for more important resistance.
COPPER FUTURES 4 HOUR

Copper has broken out above trendline resistance. The top side of this trendline is now proposed support (blue line) near 4.28. The 50% retrace and September high are well-defined for possible resistance at 4.4715.
NASDAQ FUTURES (NQ) DAILY

NQ held the channel perfectly and the next possible pivot is the center line near 16354. Trade around the center line was sloppy recently but the line was precise support back in August so there is precedence for this line to produce a reaction.
12/20 – NQ is testing the lower line from the channel that originates at the March low. This is a well-defined channel. Every important pivot since March (highs and lows) has occurred on the channel. So, it’s make or break! That simple.
EURUSD 4 HOUR
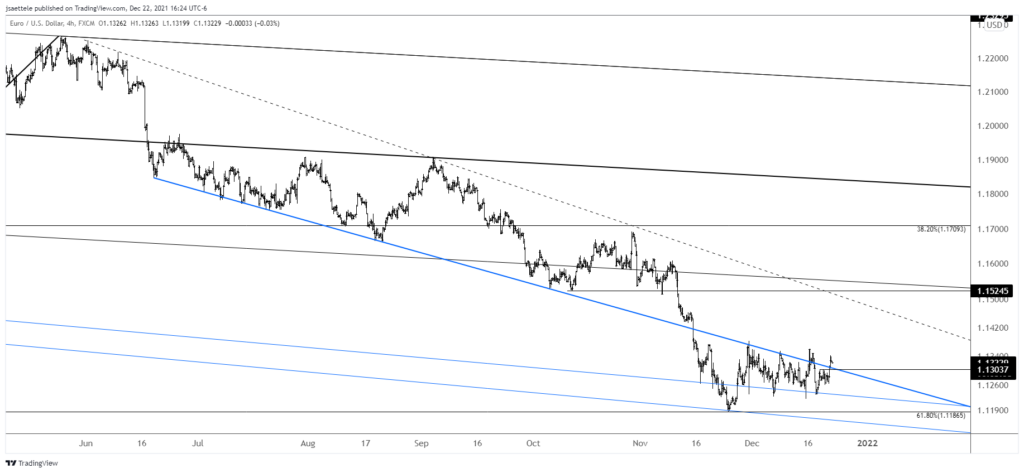
EURUSD is once again flirting with an important breakout above the trigger line. Price is more or less right at the line now. Again, a break above is needed in order to indicate an important behavior change. Ideally, price rises a bit more before pulling back to the line near 1.1300 and holding it as support. That’s the setup at least! Near term upside remains about 1.1520.
12/15 – Is the nightmare correction over for EURUSD? The ‘look’ is definitely there. For Elliott nerds, everything from the 11/30 high constitutes a complex correction labeled W-X-Y. This means that the drop is in 3 waves but the corrective legs of the structure are also corrective in nature. Upside focus is the 161.8% retrace at 1.1540, which is also the 10/29 low. Proposed support is the high volume level from today at 1.1273 and 61.8% of today’s range at 1.1252. ECB is tomorrow.
GBPUSD 4 HOUR

GBPUSD is indeed making progress from the bottom of the channel. Immediate focus is the center line and September low at 1.3411. If price pulls back from that level then support should be 1.3270s.
12/20 – Cable remains above the high, although barely. I continue to ‘think’ higher in GBPUSD given the well-defined price level that price is hovering above. Again, this is VWAP from the March 2020 low and channel support. There is also the high from March 2020 and the 38.2% retrace of the rally from March 2020. Finally, there is RSI divergence on the 4 hour chart. Magenta dots in the chart below show divergent readings over the past year.


