Market Update – June 16th
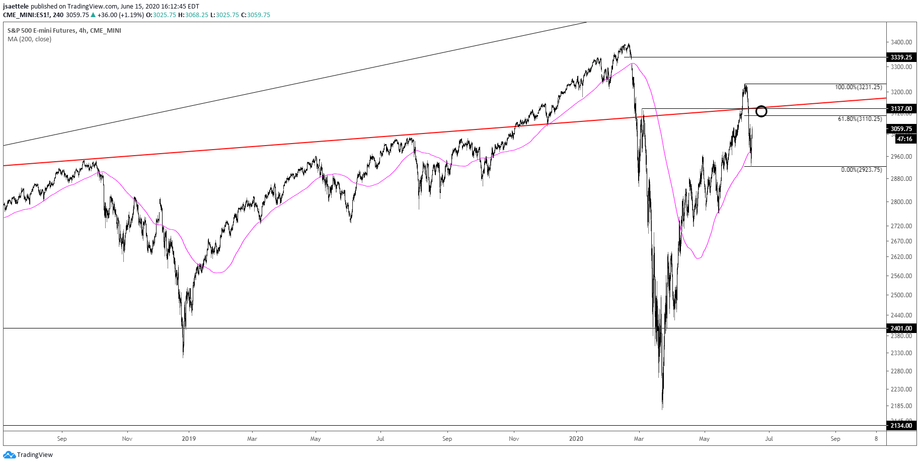
S&P 500 FUTURES (ES) 4 HOUR
I’m thinking that ES carries into 3110/37 before encountering stronger resistance for another leg lower. The zone is defined by the 61.8% retrace and underside of the line that crosses pivots (high and lows) since 2018 (red line).
SPY 30 MINUTE

SPY held the lower parallel of the Schiff fork from the March low. Price reached VWAP from the high today but a better level for resistance is probably the 61.8% retrace at 313.22. This is also near the center line of the Schiff fork.
6/11 – In SPY, 294.88 is a possible bounce level but the biggest zone to pay attention to (decision zone perhaps) is the low 280s. This is the 38.2% retrace of the rally, 2020 VWAP, VWAP from the March low, and simply a horizontal level that’s been important since August.
USO HOURLY

The USO (oil ETF) pattern is clear. The drop from last week’s high is in 5 waves and is viewed as wave A of a 3 wave correction. Ideal wave B resistance is former support at 27.72. This is also the 61.8% retrace of the 5 wave drop.
6/11 – Oil is correcting the 5 wave rally and focus for support is still 22.50-23.50 (the top of this zone is VWAP from the low). Correlations change so don’t assume that if oil finds support and a higher low then equities have to do the same. They could continue to move together or diverge. I don’t know. Nobody knows. Analyze each market separately.
EURUSD HOURLY

EURUSD is nearly back to the noted 1.1340. I’m on alert for a turn lower between 1.1340/72. The top of the zone is daily reversal resistance.
6/14 – EURUSD tagged resistance on Friday and rolled over. However, price could bounce back to 1.1340 given the specter of a 5 wave decline from the high. Under this scenario, 1.1340, which is the 4th wave high and 61.8% of the drop, should provide resistance again. Broader focus does remain lower.
AUDUSD HOURLY

Commodity currencies are forming flat patterns from Friday’s Asian session. AUDUSD has already exceeded the end of wave A so I’m on the lookout for a turn lower. I’m thinking that this happens from either the 200 hour average at .6930, the 61.8% retrace at .6961, or the 75 line within the channel from the 4/3 low at .6988.
6/11 – AUDUSD is into a noted bounce level at .6855. If price bounces then resistance should be .6933 (high volume level and underside of neckline). Downside focus remains the lower parallel.
NZDUSD HOURLY

NZDUSD has also exceeded the end of wave A and is testing the 200 hour average. Price could turn down now but a better level for resistance is probably the 61.8% retrace of the decline from last week’s high at .6511.
6/11 – NZDUSD is rolling over from the top of the channel from the March low. .6323/50 is a possible bounce level. This is the center line of the channel and the 38.2% retrace of the rally from the May low. Bigger support is probably the lower parallel and 61.8% retrace at .6166. Proposed resistance is the 6/9 low at .6469.
USDCAD HOURLY

USDCAD is also forming a flat! Price has yet to take out the wave A low, which is one reason to suspect that the flats in commodity currencies are not complete. Ideal support is 1.3450/90. This is the 61.8% retrace, 200 hour average, and 6/9 high. Broader upside focus remains 1.3833. USDCAD sports the cleanest short term levels of the commodity currencies in my opinion.
6/11 – USDCAD is headed to the top of the channel, which intersects the 5/29 high at 1.3833 early next week. If price pulls back then I’d think that support is near 1.3541. This is the 6/4 high and was an important level after the gap higher on 3/9 (Saudi crude news).
AUDJPY HOURLY

AUDJPY found support near the bottom of the channel from the March low. The decline from last week’s high though is in 5 waves (with a truncated 5th wave) so I’m anticipating a corrective rebound. Resistance is either 74.90-75.18 or 75.88. The bottom of the zone is the 61.8% retrace, former support, and the 200 hour average. The top of the zone is the 78.6% retrace and underside of the center line.
6/9 – If AUDJPY is going to continue to pull back after taking out the December high, then resistance should be near 75.90. This is the 75 line of the channel from the March low. This line was support last week so watch it for resistance now. The downside level of interest is the lower parallel near 72.80.


