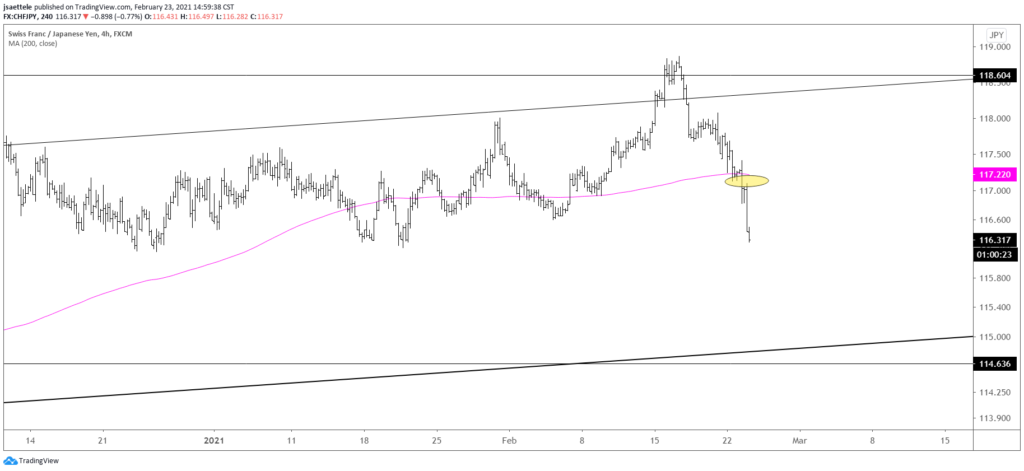
Market Update 2/23 – Interesting CHFJPY Setup!
S&P 500 FUTURES (ES) 4 HOUR
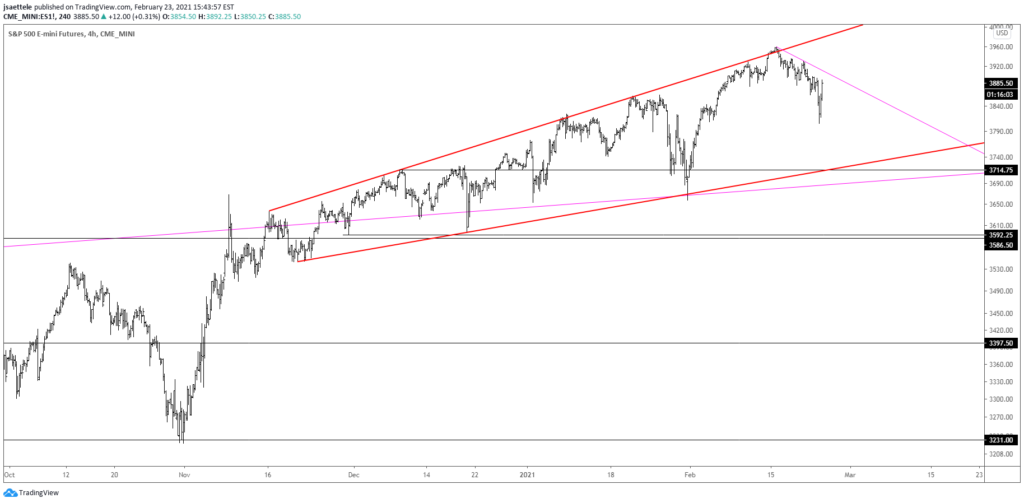
S&Ps have turned down from expanding wedge resistance. The bottom of the wedge is 3715. Everything until then is ‘noise’ but keep 3910 in mind for possible resistance.
2/17 – ES price behavior since mid-November takes the form of a rising wedge. In Technical Analysis of Stock Trends, Robert Edwards and John Magee wrote the following (over 70 years ago);
The Wedge is a chart formation in which the price fluctuations are confined within converging lines. A Rising Wedge occurs when both of these converging lines slope upwards….and betrays a gradual petering out of investment interest. Even though prices are advancing, each new up wave is feebler than the last. Finally, demand fails entirely and the trend reverses. Thus, a Rising Wedge typifies a situation which is growing progressively weaker in the technical sense.
The bottom of the wedge is currently about 3705. Price has been riding along the upper wedge line for almost 2 weeks. When/if that lower wedge line breaks, I’ll discuss downside targets.
USDCHF DAILY
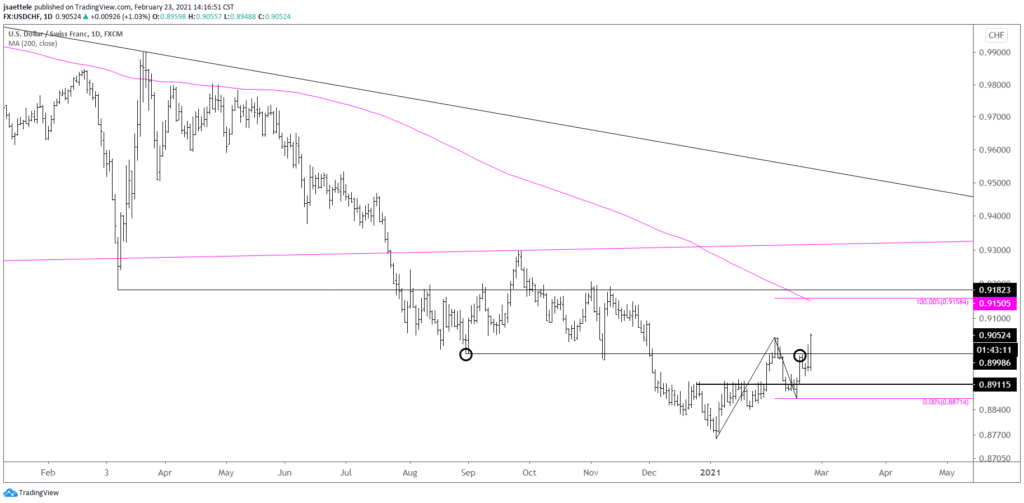
A head and shoulders bottom formed from late December until late January in USDCHF. Price broke out to confirm the pattern and pulled back sharply. The pullback is nothing more than a re-test of the h&s neckline. Upside focus is .9150/80 (200 day average, 2 equal legs up, and March 2020 low). Support should be near .9000 now.
NZDUSD DAILY
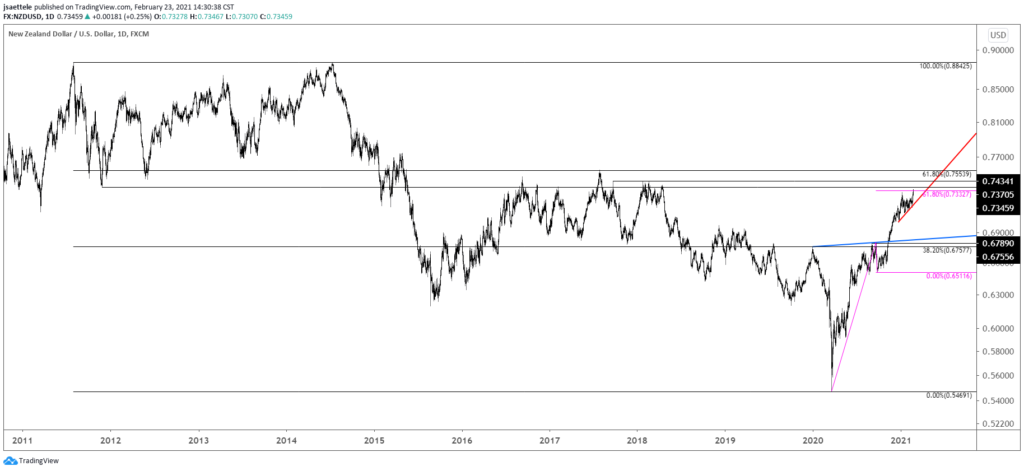
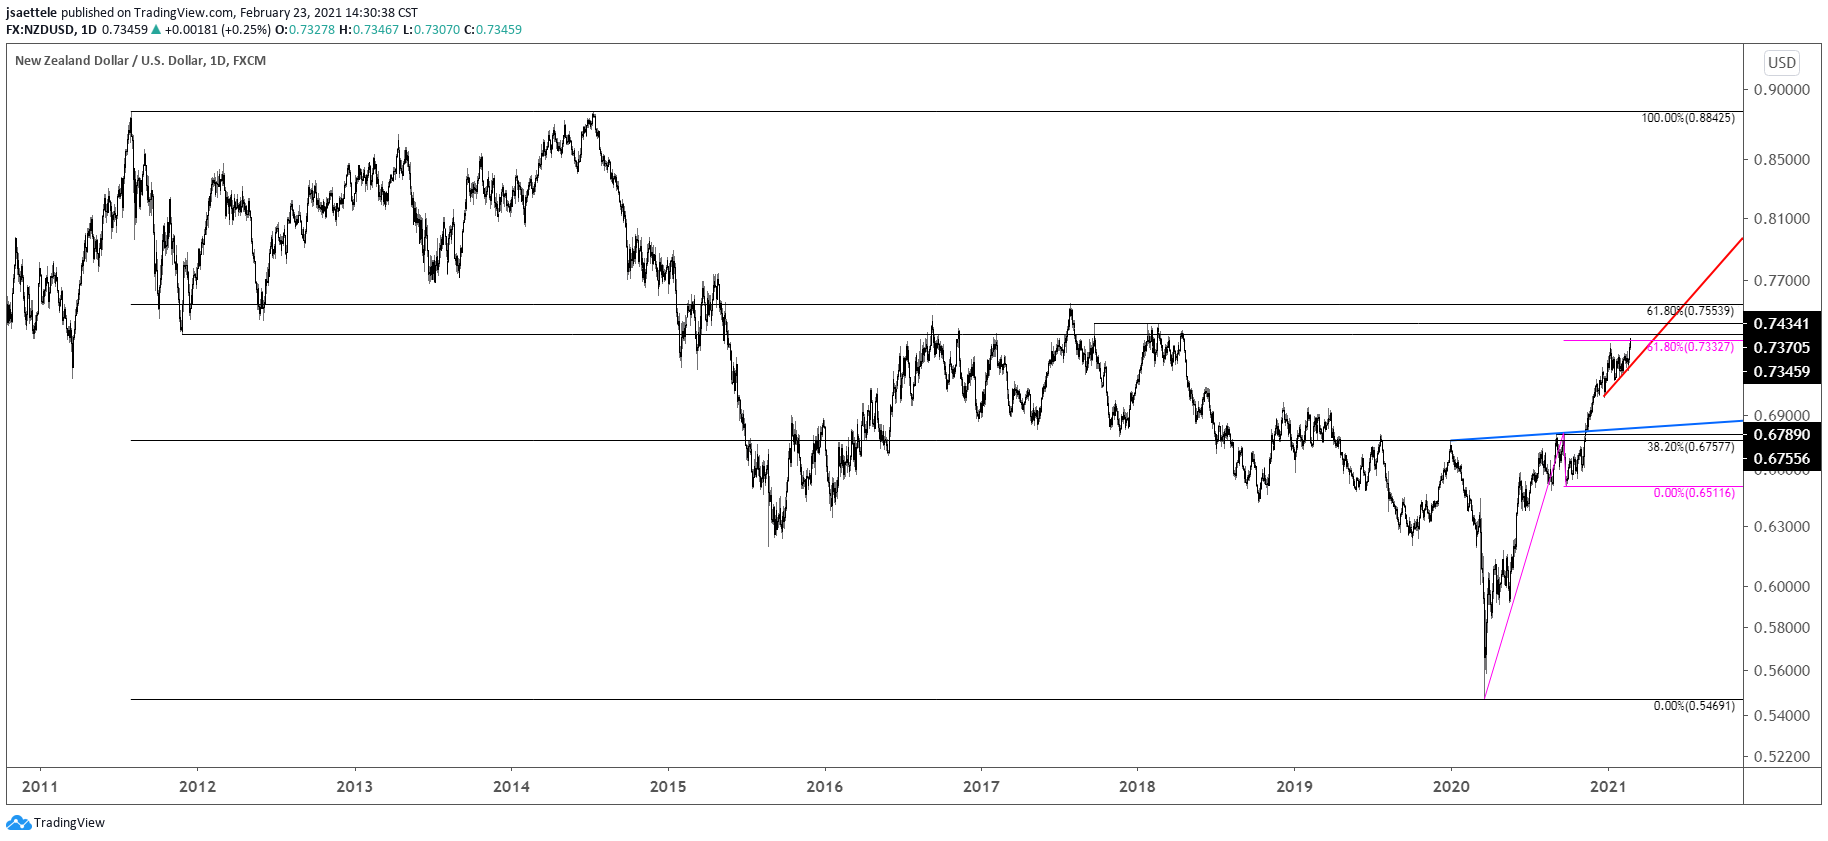
NZDUSD has entered a massive zone (.7370-.7550). The bottom of the zone is defined by the November 2011 low and where the rally from the March 2020 low divides into Fibonacci proportion (2nd leg of the rally equals 61.8% of the first leg). The top of the zone is defined by the July 2017 high (also the 61.8% retrace of the decline from the 2011 high). RBNZ is tonight, which brings forth the potential for volatility and a reversal (or the beginning of a reversal process) from significant price levels.
USDTRY 4 HOUR
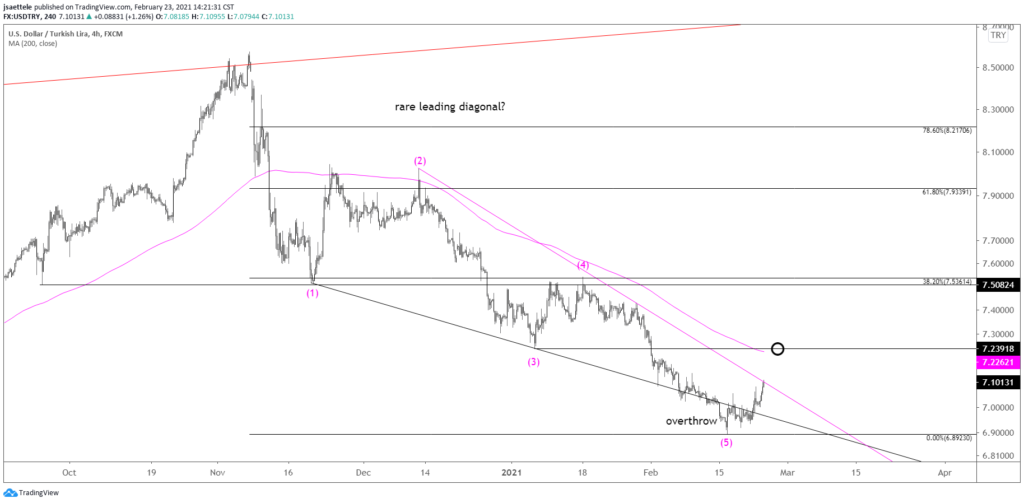
USDTRY price action from the November top may compose a rare leading diagonal (wedge). Price is pressing against the upper wedge barrier. A break above would confront the 200 period average on the 4 hour chart as resistance. The setup would be to buy a re-test of the top side of the wedge line. If the leading diagonal interpretation is correct, then USDTRY likely retraces a significant portion of the decline from November…61.8% to 78.6% of the drop. That’s a big move.
CHFJPY WEEKLY
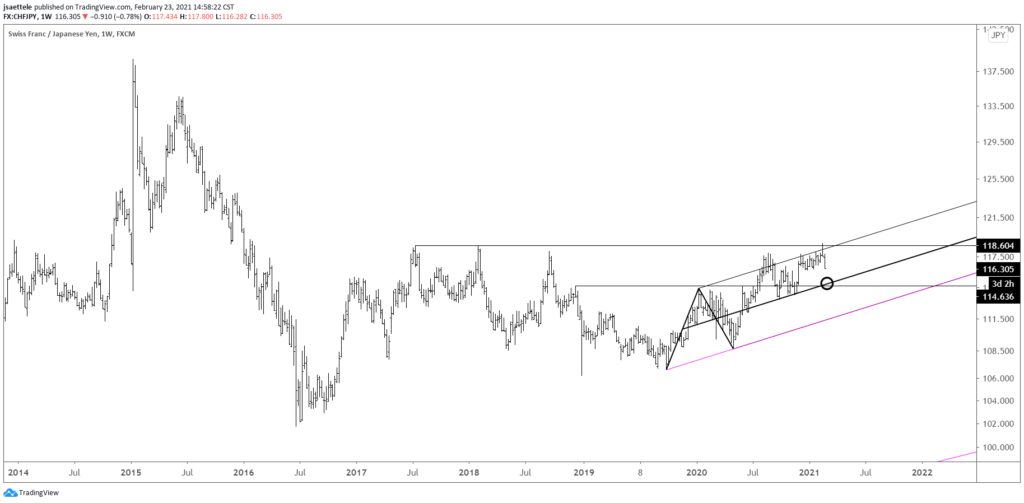
CHFJPY has tanked after taking out the 2017 high last week. The rally from the October 2019 low fits neatly into a channel and near term focus is on the center line from that channel near 114.90. This line was support from September to November. Watch for resistance at 117.00/20 (see 4 hour chart below).
CHFJPY 4 HOUR
