Market Update: November 23
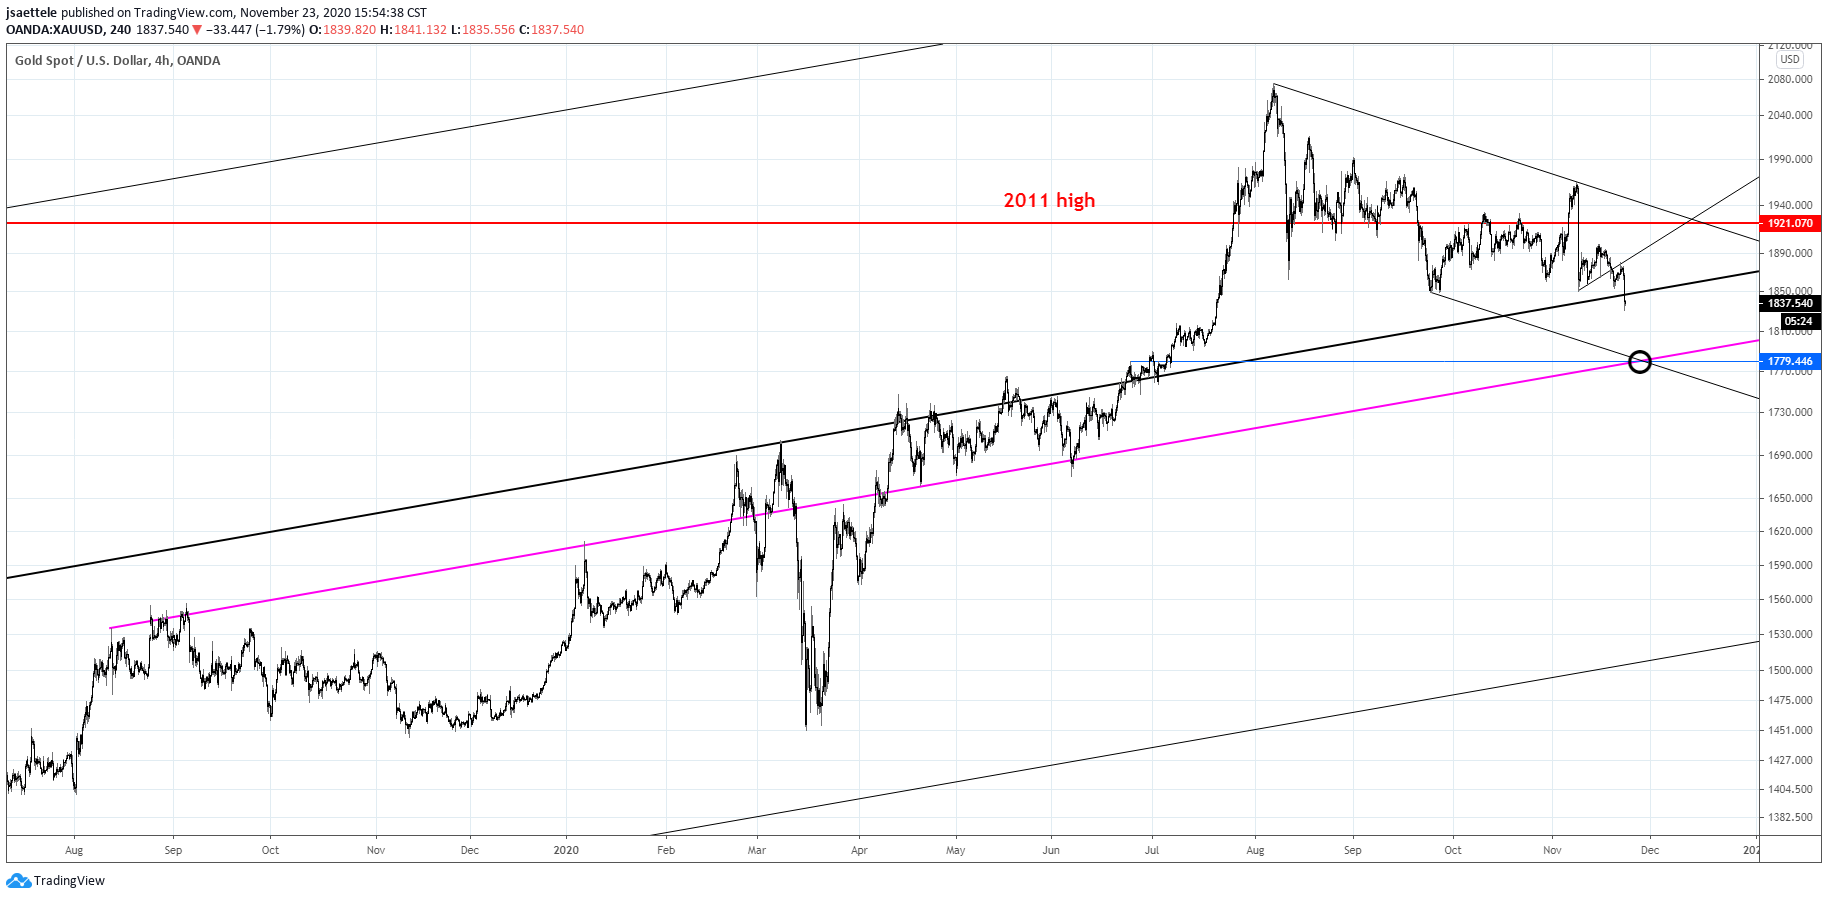
SPOT GOLD 4 HOUR

Gold tagged proposed resistance on Friday and dumped today…beautiful. Price is quickly approaching the long held support near 1780. This level is an important parallel and the lower channel line from the bearish channel off of the August high. I’ll be paying close attention to 1780 for reversal evidence.
11/19 – Assets prices were down in early U.S. trading as the USD rallied but everything reversed course when the magical U.S. session got underway (stocks up, metals up, USD down, etc.). I still like gold lower but a bit more strength may be in order to test resistance near 1876.
JJC DAILY

JJC is the copper ETF and it made a big volume reversal today. Volume was more than 2.5 x the 20 day average. Reversals with that magnitude of volume are shown on the chart. The signals are impressive. It’s time to look lower in copper. 43.00ish looks like a magnet for support. That’s a little over 13% lower from the current level.
11/16 – Copper is at new highs and again testing channel resistance. Be aware of the potential for failure up here again. If strength persists then know that the 2017 high is at 3.2220. A push above there would put copper at its highest level since 2014!
U.S. DOLLAR INDEX FUTURES 8 HOUR

The reversal in DXY today produced an 8 hour volume reversal. Reversals over the last year + are shown on this chart. There were several false signals in early June as DXY started to break down but the other signals did identify important turns. Don’t forget that DXY is still sitting on the long term support line (see below)!
11/18 – DXY is STILL sitting on top of the long term trendline support. The last 2 daily candles have a bullish ‘look’…long lower wicks with small bodies and small upper wicks. The weekly chart is below to remind of the importance of the current level.
DXY DAILY

GBPUSD DAILY

GBPUSD did see that final spike into 1.3382. Again, this is daily reversal resistance and the median line from the structure that originates at the September 2019 low. An 8 hour volume reversal also triggered (see below). I am looking lower with initial focus on the well-defined 1.3000.
11/19 – Cable continues to fail near the upper end of the channel from the 9/23 low. A break under today’s low would warrant a near term bearish stance with focus on 1.3000. Until then, respect potential for a final spike into 1.3382. This is daily reversal resistance (close of the high day) and the median line from the structure that originates at the September 2019 low. This line was precise resistance in April and June, and support in August.
BRITISH POUND FUTURES 8 HOUR

NZDUSD DAILY

Kiwi high today was 1 tick under the December 2018 high and the pair ended up carving a doji. The combination of the candle pattern and major horizontal level is enough (for me at least) to take a bearish stance. Initial downside focus is former resistance at .6800.
11/18 – Kiwi tagged the 2019 high today at .6942. The December 2018 high is just above at .6969. Simply, be aware of significant horizontal levels because reactions tend to occur. Also, I’m interested to see how NZDUSD closes this week in relation to the multiyear channel. A close below would be viewed in a bearish light.
USDTRY 4 HOUR

The proposed 3 wave rally is well underway in USDTRY. Watch for support now near 7.78. 8.05 (50% retrace) is possible resistance along with the mentioned 8.17.
11/22 – The USDTRY decline is in 5 waves so expectations are for a 3 wave rally before additional downside. 7.7787 is initial resistance but respect potential for a deeper retracement. The upper end of the resistance zone is the 61.8% retrace of the decline at 8.17.


