Market Update 8/31 – Pivot Low in the USD?
USDOLLAR DAILY
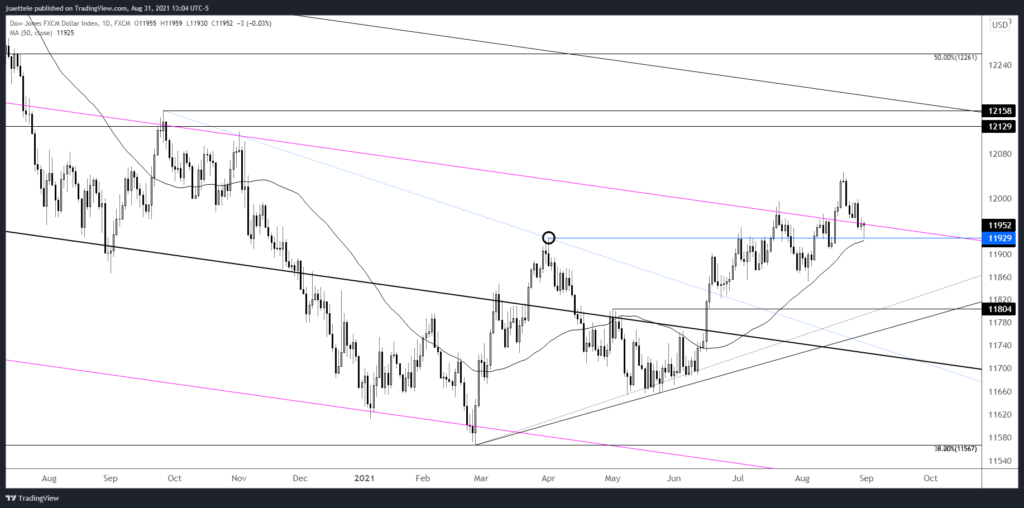
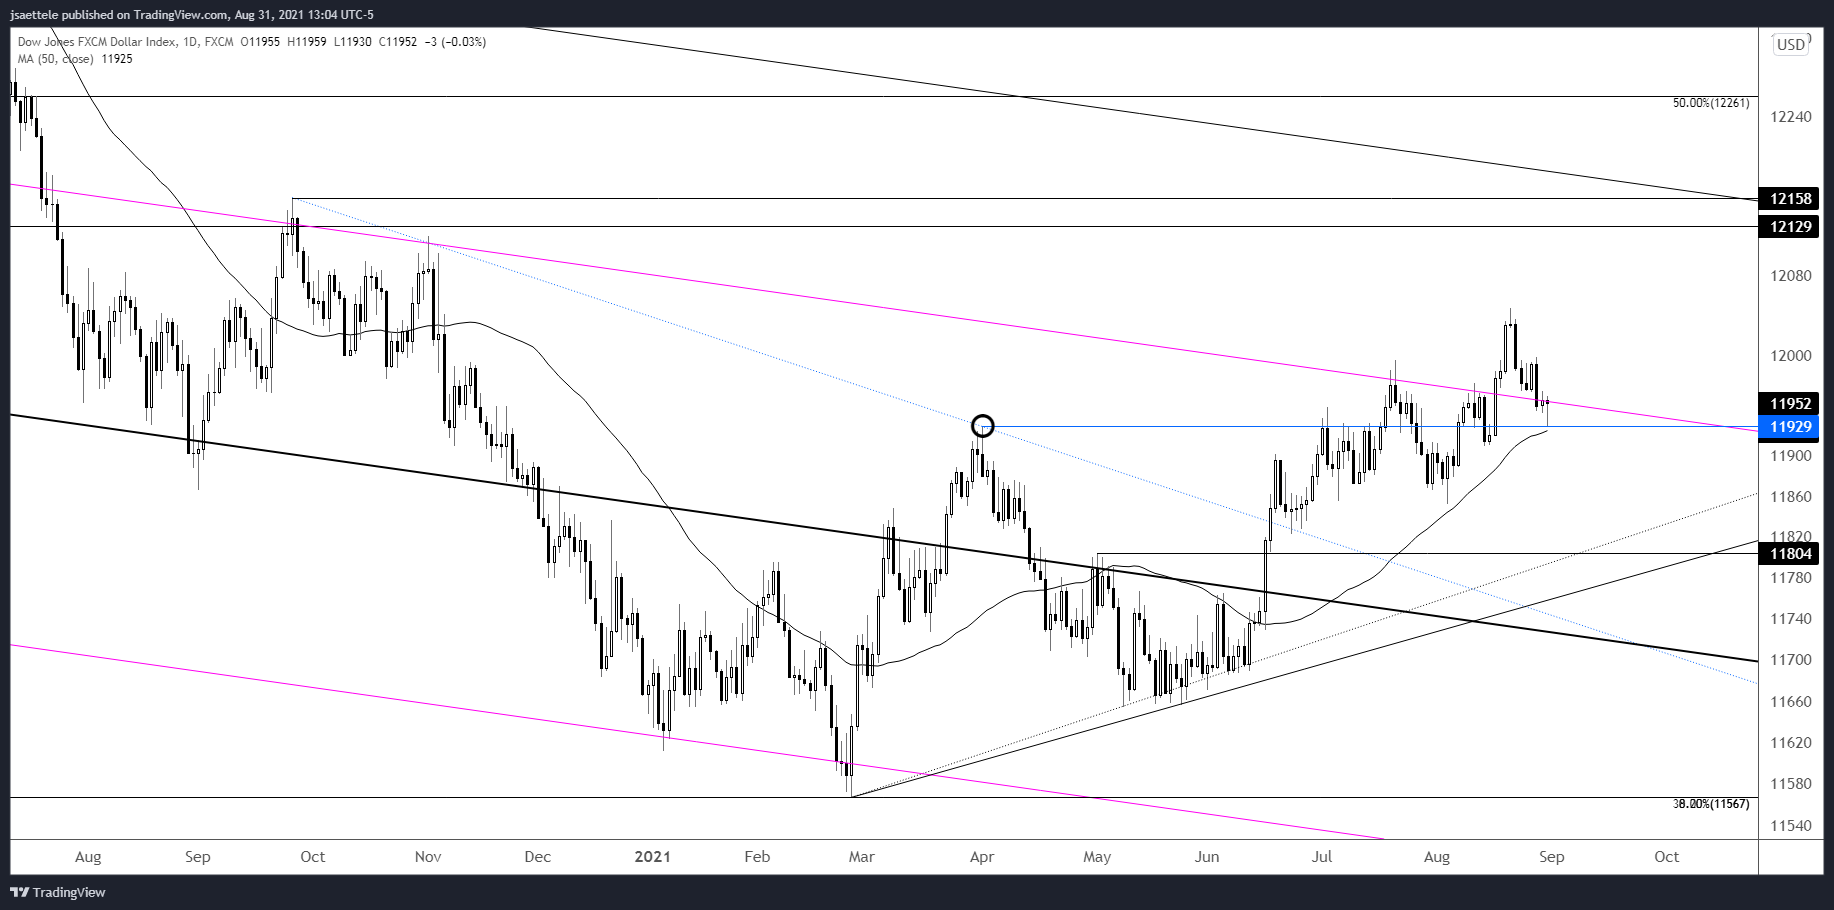
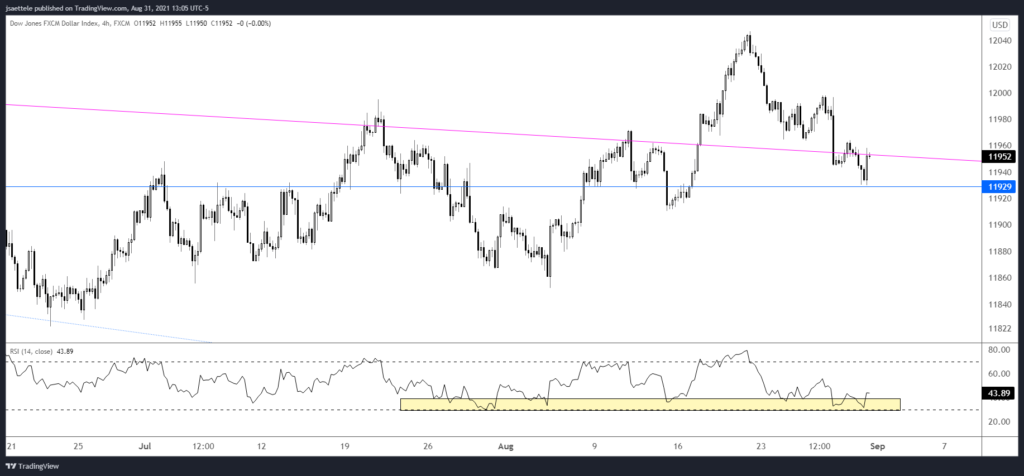
USDOLLAR spiked lower on the last day of the month but recovered to finish the day virtually unchanged. Price is RIGHT at 11950. In fact, today’s low was one tick above the April high (former resistance is now support) and just above the 50 day average too. My view is that the USD is still in an uptrend. The question is whether or not the dip within the uptrend is complete. Today’s action (long lower wick into a well-defined level) is a good way to make the next pivot low. Also, 4 hour RSI continues to bottom above 30 (see below). Remember, this is characteristic of a ‘bullish RSI profile’.
8/30 – USDOLLAR is testing proposed support at 11950. Pretty simple here…price needs to hold this level in order to remain constructive and trade the USD from the long side. A break here would indicate an important behavior change and suggest that a deeper drop is underway…possibly towards 11800 or so.
USDOLLAR 4 HOUR
DXY DAILY
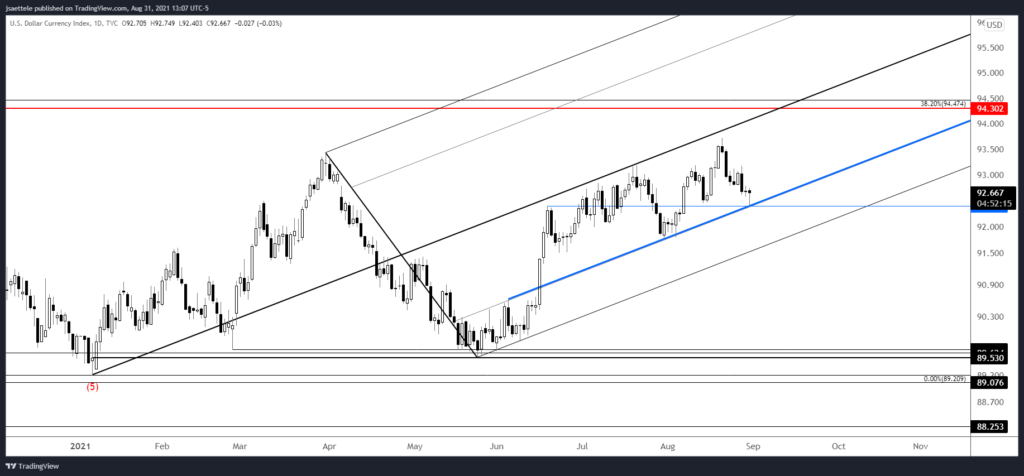
DXY slipped under the 8/13 low today before turning back up. This may have been a stop run in order to rid the market of weak longs so that the next leg up can take place. Today’s low is also right at the 6/18 high and on an extremely well-defined parallel that was support in late July/early August. Similar to USDOLLAR, the reaction at a well-defined level indicates that the USD dip may be complete.
EURO FUTURES 4 HOUR
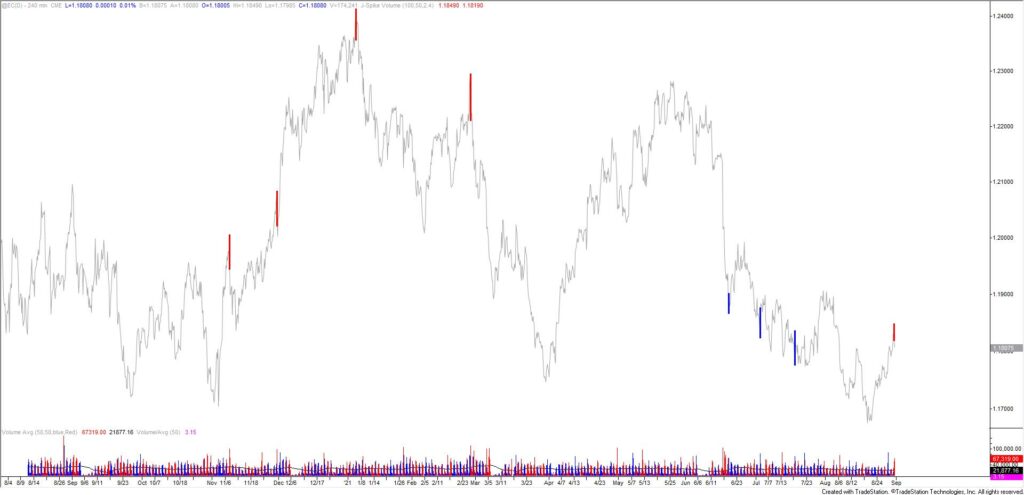
Strength above the important 1.1800 was short lived and euro futures carved a 4 hour volume reversal as well. Signals are shown for the last year. There are some good ones, including the high of the year and the succeeding lower high in February. As such, I favor trading from the downside again now with a tight stop. I’ll examine downside potential if this gets going but the November low (election low) at 1.1600 is an obvious level to keep in mind.
8/30 – As one would think given USDOLLAR analysis, EURUSD is testing important resistance. 1.1800 (as noted last week) is being put to the test and this level needs to hold in order to continue looking lower. Today’s range is virtually non-existent so I’m on the lookout for a reaction (reversal or breakout) before committing to a direction. A break above would open up the 7/30 high at 1.1909.
GBPUSD DAILY
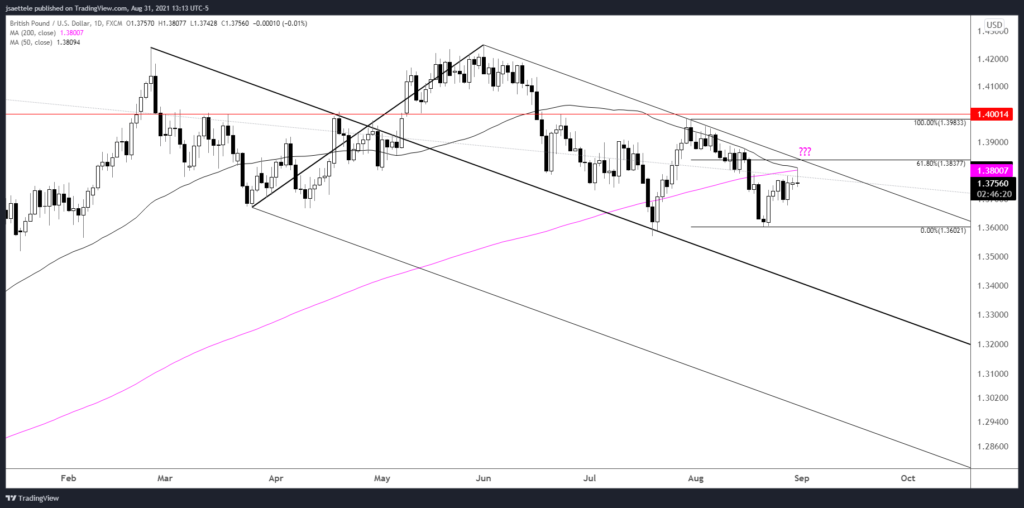
GBPUSD resistance registered from the confluence of the 50 and 200 day averages today and the day’s action left a bearish candle. That said, it’s difficult for me not to notice the intersection of the 61.8% retrace and upper parallel of the bearish structure from the February high at 1.3838. Bottom line, I’m torn on downside now or from slightly higher. If the near term picture clears up (such as a break under 1.3734), then I’ll adopt a more immediate bearish stance.

