Market Update: November 24
CROSS ASSET MOMENTUM BREADTH

First, some non-price observations are worth noting to understand the current sentiment landscape.
From Deutsche Bank: “With almost every asset class having rallied strongly in risk-on fashion over the last two weeks, our measure of the breadth of cross asset momentum is now at the top of its historical range, back to levels seen in early June and at the end of last year”
FEAR AND GREED INDEX

The fear and greed index from CNN Business is back to where it was early in the year.
SPX DAILY

SPX is back to the line that connects highs since 2018. Remember, this line crosses pivots for the last 90 years.
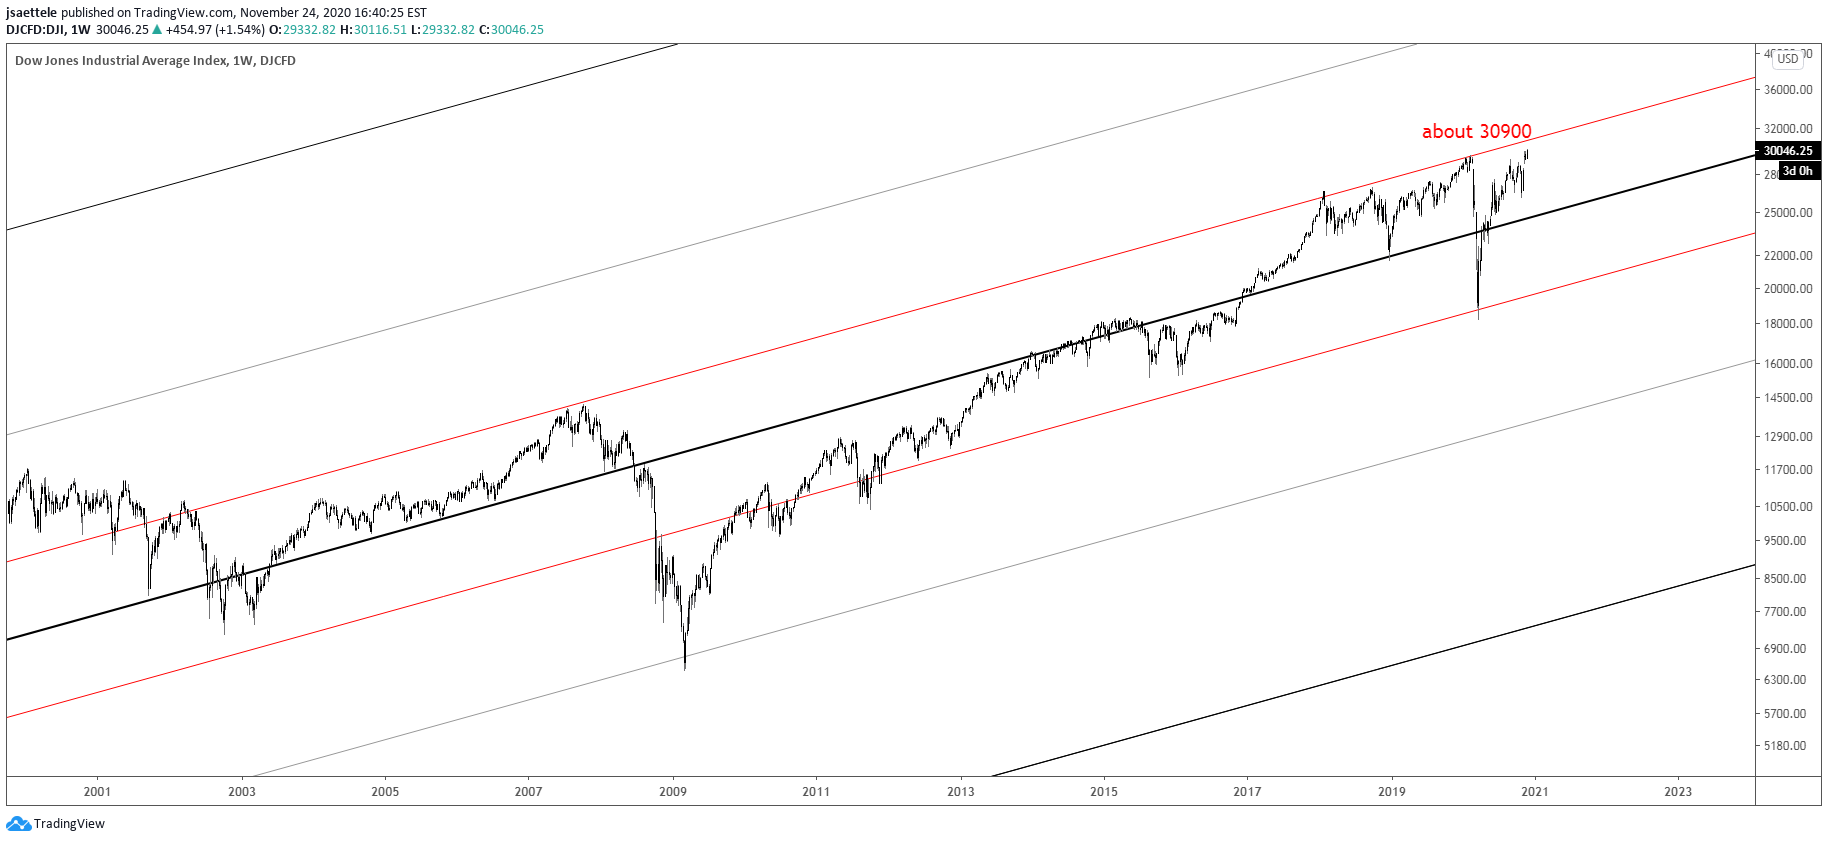
DOW WEEKLY

There is a massive parallel in the Dow at about 30900 that is worth noting. The line crosses the 2007 and 2018 highs and high from early this year. The line equidistant from the median line (concept symmetry) was support in March. These parallels are based on the line that connects the 1932 and 1982 lows (see monthly chart below).
DOW MONTHLY

BTCUSD DAILY

Bitcoin has reached the noted parallel. High today was $24 below the 2017 high. When a rally is described as a ‘breathtaking rocket ship launch‘, I tend to think that the market in question is near a peak.
11/17 – Bitcoin! Heads up because ‘digital gold’ is quickly approaching its all time high of 19666. Just under this level is a parallel that crosses major levels (mostly from 2015 to 2017). BTCUSD is a long term bull but I’m of the mind that we see a strong reaction from the parallel/all time high.
EURUSD 4 HOUR

EURUSD continues to do a whole lot of nothing. 1.1915 or so has been an important level since late July but the confluence of the line off of highs in March and June and the line off of the 2008 and 2014 highs is just below the September high at 1.2011. Maybe that needs to be tested before ‘something else’ happens?
AUDUSD 4 HOUR

Remember the channel from the June lows? The lower channel line, which was resistance in October and early November, is just above at about .7400 (September high is .7414). Pay attention to that level for a possible reversal.
USDJPY HOURLY

The USDJPY rally from the 11/18 low can be counted in 5 waves. Waves 1 and 4 do NOT overlap on a closing basis. I use closing prices for this rule because that’s what Elliott himself used. Anyway, support should be 104.08/14 (61.8% retrace and former 4th wave low) for the next swing low.
USDNOK DAILY

An Elliott case can be made for a strong USDNOK rally to get underway soon. To review, the decline from the March high was in 5 waves (textbook by the way). Since the September low, we’ve had a leg up and a leg down…waves A and B of a proposed 3 wave correction. As such, wave C is due to get underway and end above the September high of 9.6158. If we some reversal evidence, then I’ll plot an entry.


