Market Update – June 24
QQQ DAILY
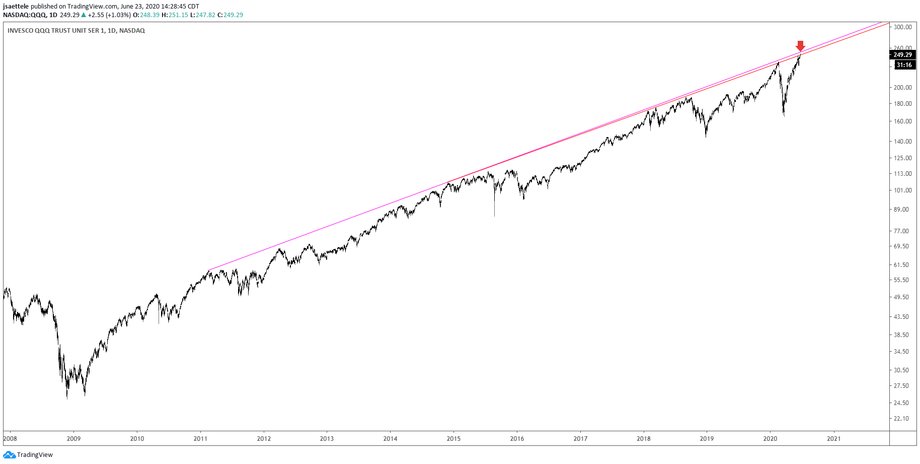
QQQ is back at the red line that was presented on 6/10. The magenta line is at about 253 now and intersects a short term upper channel line tomorrow (see below). That’s a great spot for a top. Weakness below the February high at 237.47 would also break the short term channel and indicate a behavior change.
6/10 – QQQ is running into lines that extend off of highs over the last 9 years. A close-up view is below. The red line extends off of the December 2014 and March 2018 highs. That line was resistance for the August 2018 and February tops. It was reached today. The line that originates at the February 2011 high is slightly higher…about 251.70 in QQQ.
QQQ HOURLY

EURUSD HOURLY

The EURUSD drop from 6/10 is left in 3 waves. The ‘best’ near term count at this point treats the drop from 6/10 as a 4th wave, in part because the proposed 4th wave decline retraced 38.2% of proposed wave 3! The implication is that EURUSD trades to a new high in larger wave 5 within the cycle from the 4/24 low. Ideal support now is 1.1237/41. This is the 61.8% retrace of the rally from Friday’s low and the 6/9 low. If this plays out, then waves 1 and 5 would be equal at 1.1460.
GBPUSD 4 HOUR

Recall that GBPUSD held the 61.8% retrace of the rally from 5/18. Monday’s low was also on VWAP from the March high. Given this evidence, it’s possible that action since the March low is a series of 1st and 2nd waves. Very short term, the rally from Monday’s low is in 5 waves and ideal support is 1.2410/32 (see chart below).
GBPUSD 10 MINUTE

USDJPY 4 HOUR

The parallel that was resistance today in USDJPY is the same parallel that was resistance on 6/16. There is also a possible head and shoulders top in the works over the last 8 weeks. If this is going to play out, then USDJPY should stay under former resistance at 106.92. The week open, which is always an objective level to trade off of, is at 106.80. I’m bearish against today’s high.
6/18 – Calm before the storm? USDJPY did literally nothing today. Pay attention to the 25 line of the bearish fork and specifically 107.50. The 25 line was precise resistance on 6/9 and could be again.
USDCAD 4 HOUR

With USDCAD low right on the 6/9 high, it’s worth a shot on the long side now in USDCAD (rather than waiting for 1.3450s). The center line of the channel from the May high, which was support several times in May, is proposed support for entry near 1.3510. Upside focus is the upper parallel, which is mid-1.3700s over the next few days.
6/22 – If there is additional USDCAD upside to test the multi-month upper channel line, then 1.3450s should provide support. This is the 61.8% retrace of the rally from 6/10, 2 equal legs down from the 6/15 high, and the bottom of the short term corrective channel.
NZDUSD 4 HOUR

Take a close look at everything since the 6/12 low in NZDUSD. Each leg is corrective. The suggestion is that a complex correction (labeled W-X-Y rather than A-B-C) has taken place. Also, high today was .6533…just 2 ticks under daily reversal resistance at .6535 (daily reversal resistance is the close of the high day, in this case that’s 6/10). Also, the 75 line within the channel from the March low was resistance today. This line has been resistance and support over the last month+. I lean towards the short side in NZDUSD towards the 25 line near .6350. Let’s get past RBNZ later before entering.


