Market Update 3/22 – Elliott Still Nailing USDTRY Moves!
GBPUSD DAILY
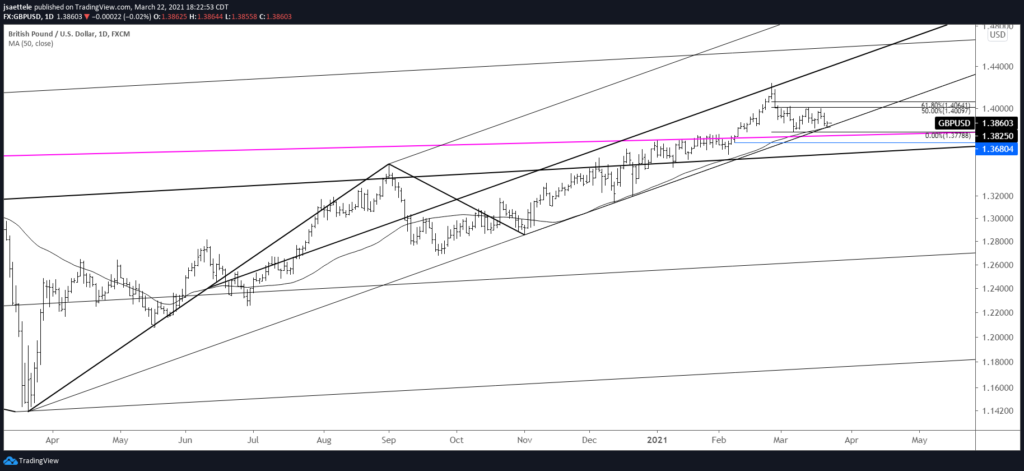
Cable remains constructive. Price reached the trendline from the March low today as well as the 50 day average. As long as this holds, I am favoring upside. The high volume level from last week is possible support at 1.3840. If price fails to hold recent lows, then the next level of interest is a longer term median line and 2/4 low at 1.3566.
3/16 – Cable overshot proposed support and reversed weakness by the end of the day. Low today was just above the 50 day average and don’t forget that price continues to hold above 2021 VWAP. As such, I maintain a constructive stance on GBPUSD.
USDCHF HOURLY
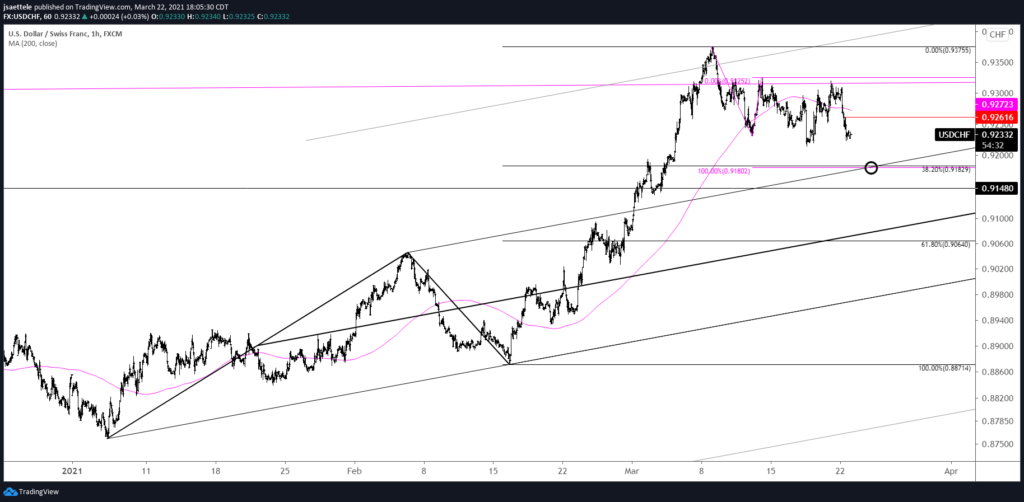
Downside focus remains .9180s for USDCHF. The 200 hour average and resistance during Monday’s U.S. session at .9262 should provide resistance again.
3/17 – With respect to general USD swings and turns, USDCHF has been informative. As such, don’t forget about the potential importance of .9180s for support. A hold at that level may indicate a return to the USD rally that started in January.
USDMXN DAILY
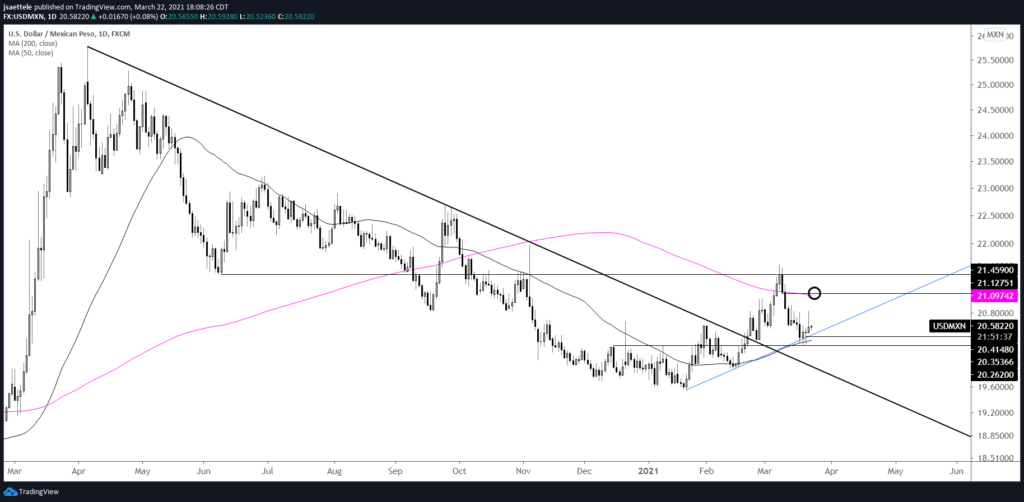
USDMXN has stabilized at trendline support and the 50 day average so upside is favored as long as price is above the 3/18 low. Proposed support now is 20.4150. Near term upside focus is 21.1275.
3/11 – USDMXN traded into the noted June low at 21.46 and has tanked since. The trendline from the low and 50 day average are in line with the well-defined 20.26 level. Watch that level for support.
USDTRY 4 HOUR
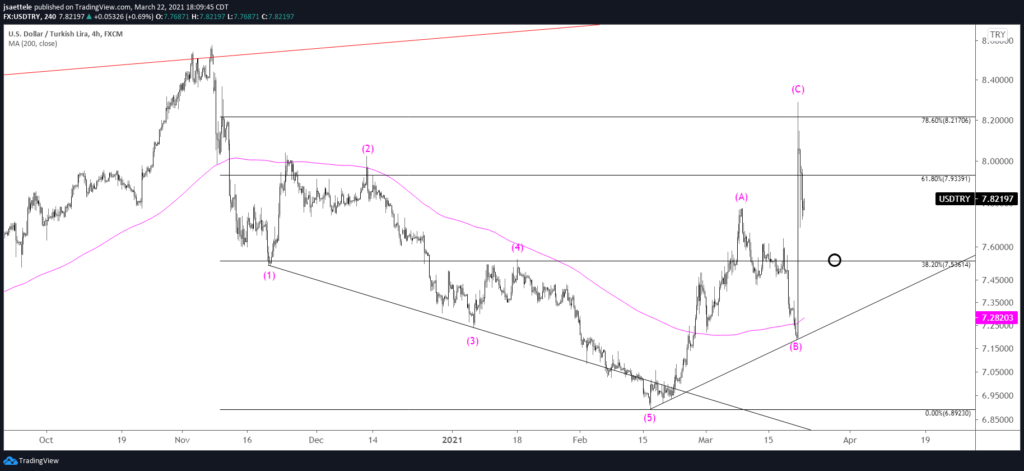
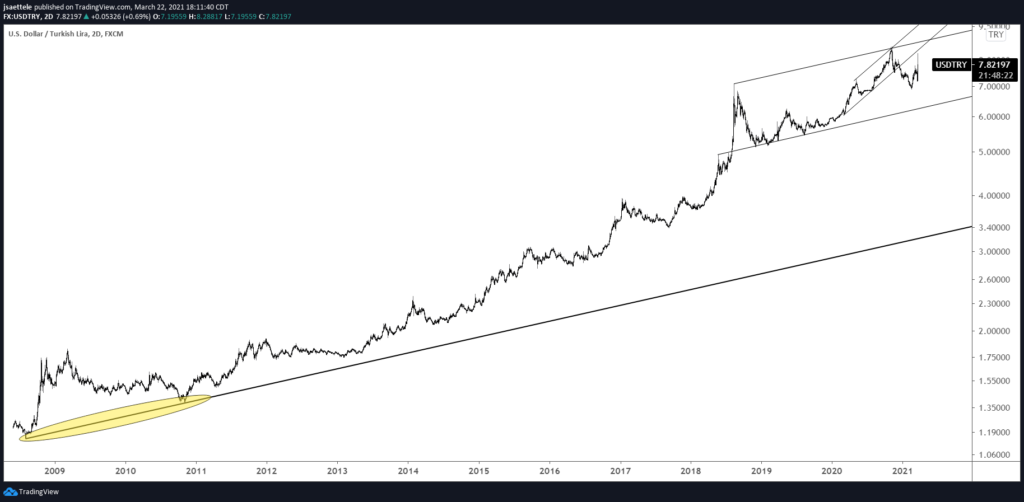
USDTRY swings remains TEXTBOOK. The massive gap higher after the weekend is wave C of the noted A-B-C advance from the February low. In fact, the high is at the 78.6% retrace of the decline from the November high. Recall that when the leading diagonal was first identified after the February low, I noted that corrections after leading diagonals tend to retrace 78.6% of the diagonal. Voila! I am bearish again and resistance is 7.9990-8.0595. Don’t forget that USDTRY remains below long term resistance (see below).
3/18 – The 2021 USDTRY charts should be in an Elliott textbook. The drop has reached the top of the proposed support zone for wave B so now I’m looking to flip to the long side. Again, the bottom of the zone is 7.23. If I see reason to suspect that a B wave low is in place then I’ll indicate as much.
USDTRY DAILY
