Market Update 8/11 – How Big of a USD Pullback?
USDOLLAR DAILY
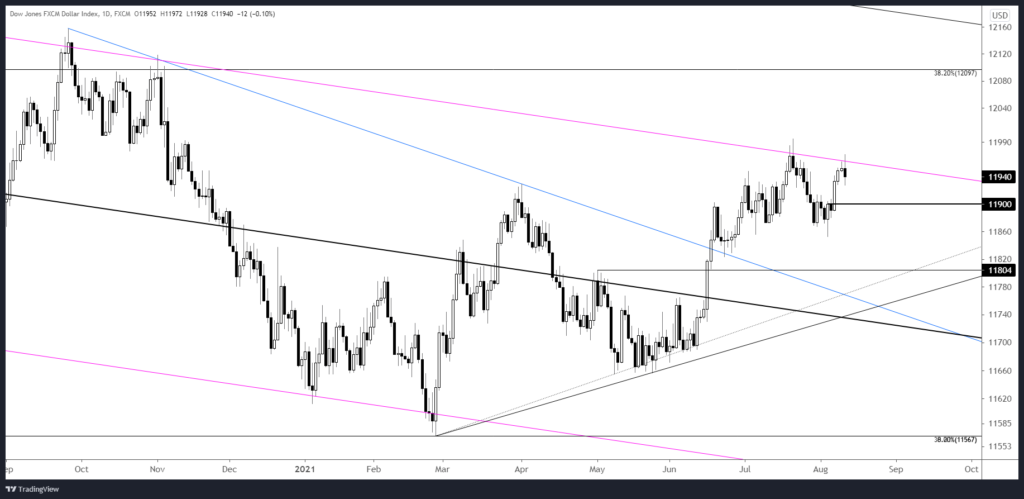
Right on cue! USDOLLAR reversed lower from parallel resistance (again) today. I’m not sure how important the high is but short term focus is lower for now. The first level to pay attention to will be 11900.
8/9 – The USDOLLAR rally from 8/4 is in 5 waves and into proposed resistance from daily reversal resistance at 11952. The ‘ideal’ zone for resistance extends to 11964. I’d welcome a pullback in order to load up on additional USD longs.
SPOT GOLD 4 HOUR
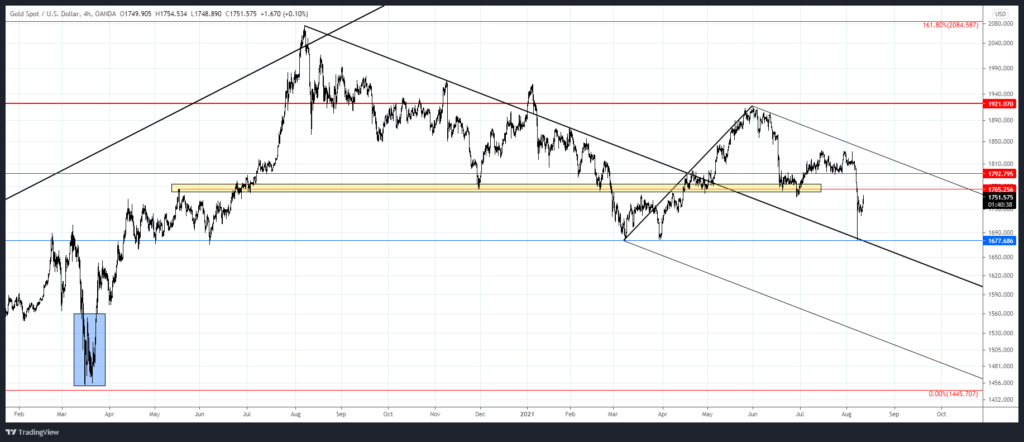
Gold has recovered most of its Sunday ‘flash crash’. I’m thinking that 1765 is resistance (close to where we closed last week) and that price consolidates in a range in order to ‘reset’ before the next move. 1733 is possible support now. Keep an eye on silver and gold. Silver is lagging during this recovery, which isn’t a good sign for precious metal bulls. Bigger turns in PMs are often marked by non-confirmations. This occurred at the March 2020 low when silver made a lower low but gold did not (see blue boxes on the above and below charts). Since the lows were made during thin conditions on Sunday night, I’m thinking that a non-confirmation occurs on hourly closes (1693 for gold and 23.05 for silver).
SPOT SILVER 4 HOUR
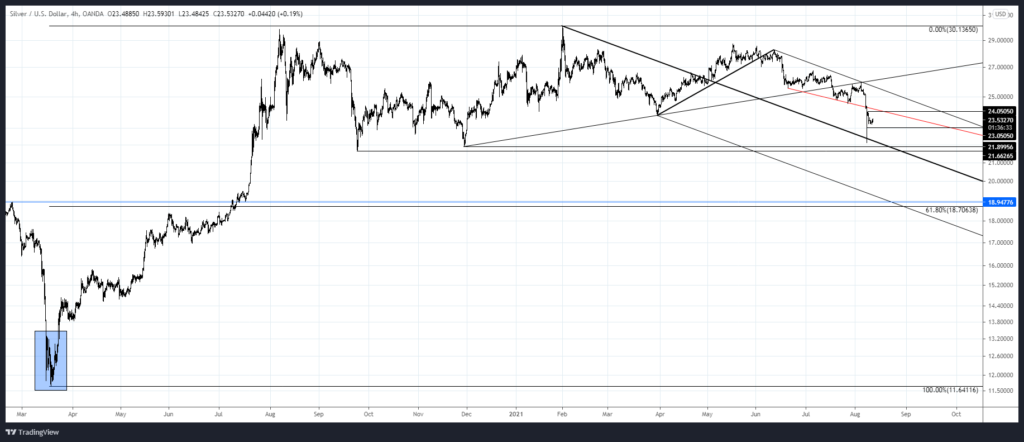
Aside from everything mentioned above regarding non-confirmations, pay attention to 24.05 for silver resistance. Again, 23.05 is possible support.
8/9 – The silver crash bounced from a median line today. While the action may feel like capitulation, I’m watching for resistance from the line that crosses lows in June and July (red line). That line is about 24.20. Very near term, price could bounce near 23.05 (see below). The 61.8% retrace of the rally from March 2020 is 18.71. Keep that level in mind for major support if reached.
EURUSD DAILY
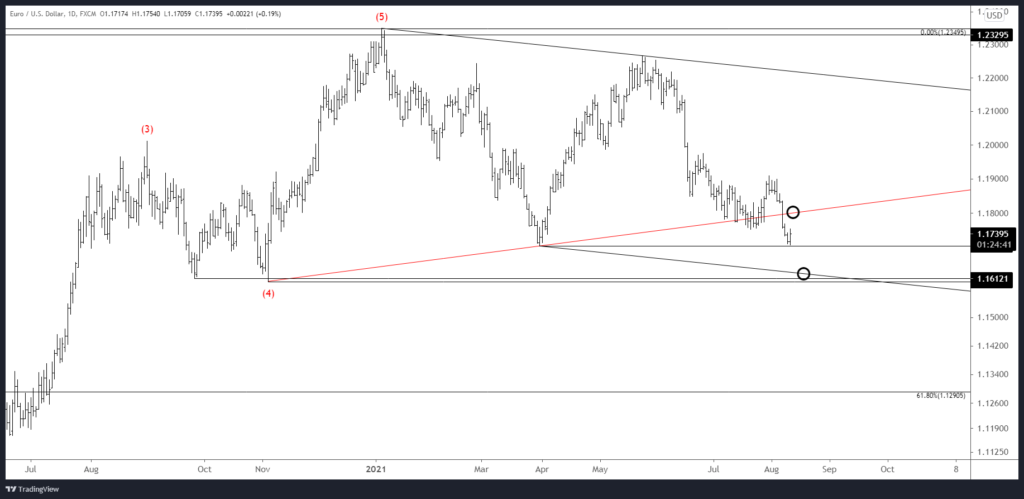
Keep it simple with EURUSD. Price bounced today from horizontal support. Former trendline support (red line) is now proposed resistance near 1.1800. A move into there would align with a USDOLLAR pullback to 11900 or so. The next downside level of interest for EURUSD is the well-defined 1.1600.
USDJPY DAILY
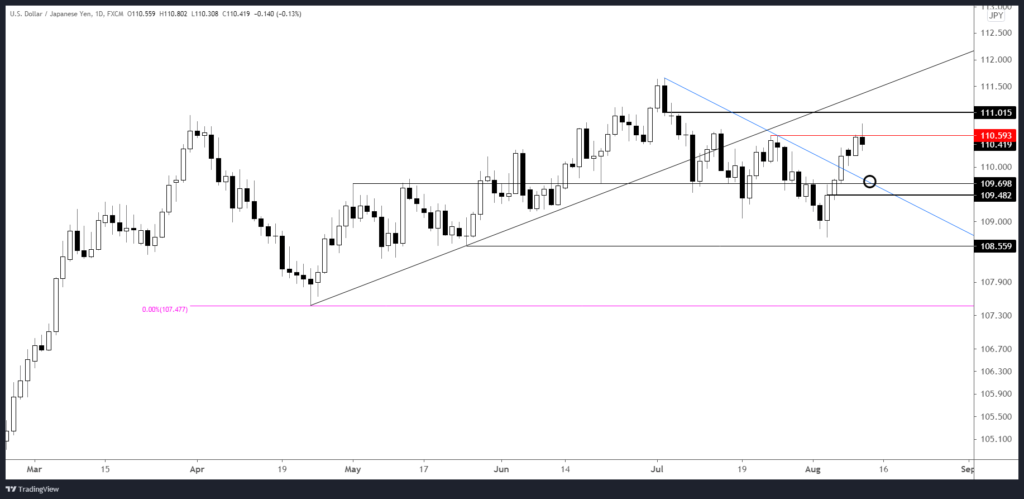
USDJPY is following the script. Near term focus is lower until the top side of the line off of the July highs (blue line). That line is around 109.70 the next few days. This chart also supports the idea of a shallow USD pullback.
8/10 – First, USDJPY broke above trendline resistance. Remember that this occurred after a daily volume reversal in Yen futures (see below). The combination is extremely bearish Yen (USDJPY bullish). Eventually, the top side of the trendline (blue line) is proposed support. If price is going to pull back, then 110.70-111.00 should provide resistance (the top of the range is daily reversal resistance and the March high).
AUDUSD DAILY
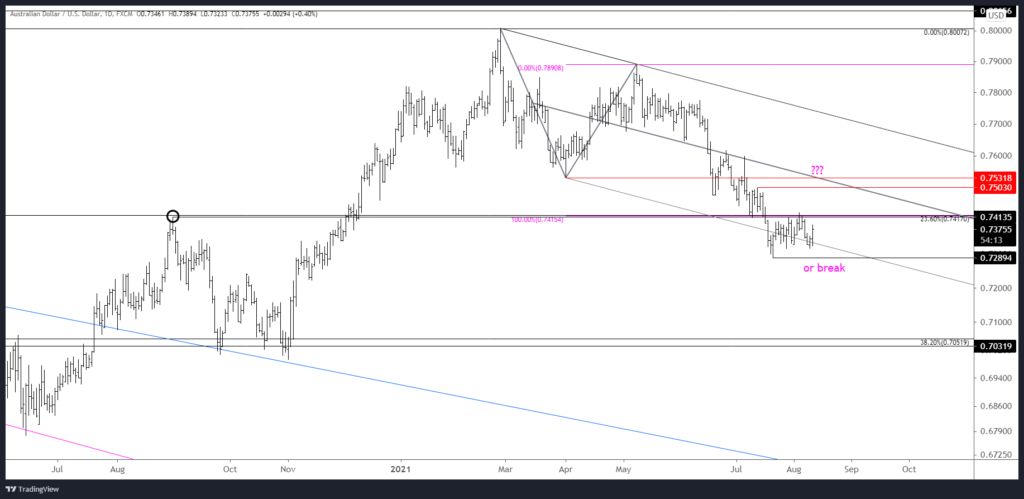
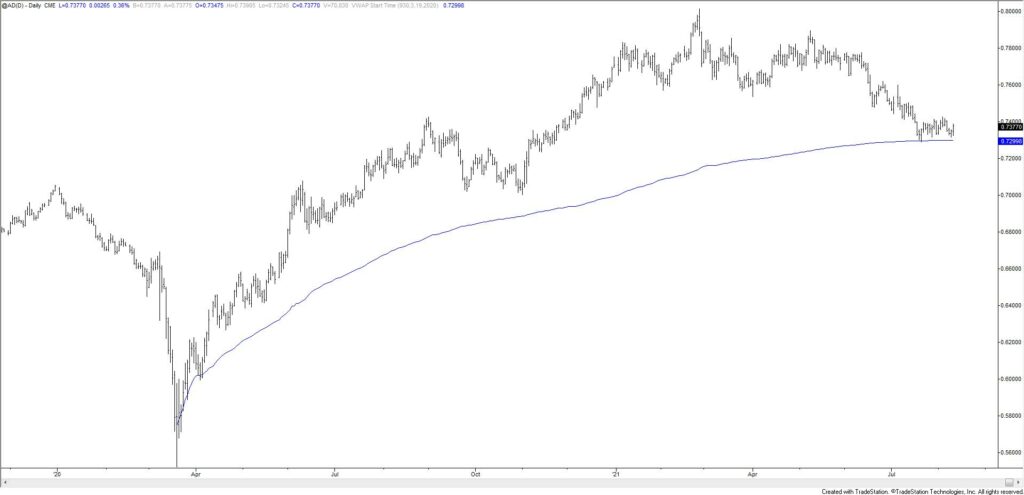
Aussie is a hot mess. Price remains capped by the massive .7415 but the wedge is morphing. I’m not interested in AUDUSD until price breaks above .7415 (possibly bullish given the VWAP hold…see below) or to new lows. A break above .7415 would face a test from .7500/30.
8/10 – Copper and AUDUSD tend to move together (see above), which reinforces the bearish AUDUSD view. With 5 waves down in AUDUSD from 8/4, today’s bounce is viewed as corrective. .7370 is well-defined for resistance and a short entry.
AUSTRALIAN DOLLAR FUTURES DAILY
USDTRY DAILY
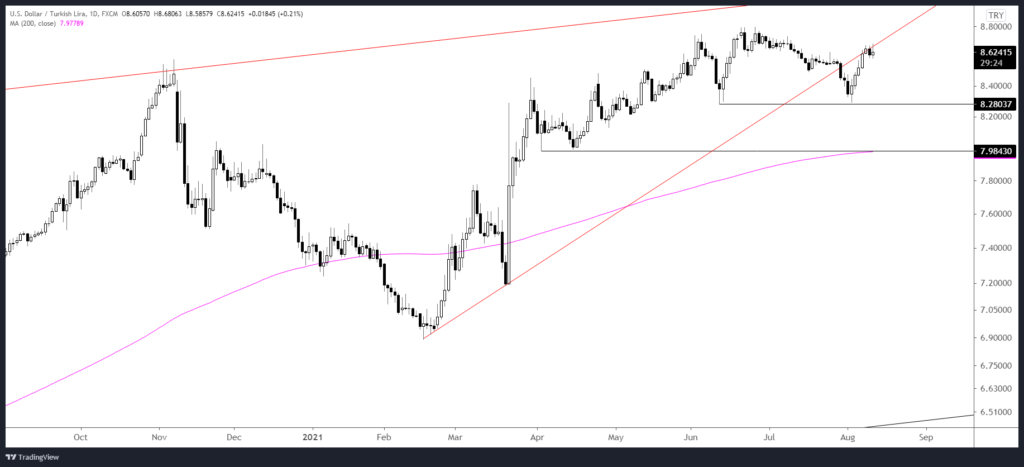
USDTRY has been trading on the underside of the 2021 trendline for the last 4 days. Today’s action took out the prior 4 days before price closed relatively unchanged. I’m bearish against today’s high.


