Market Update 5/9 – Resistance in Bond Yields?
DIA DAILY
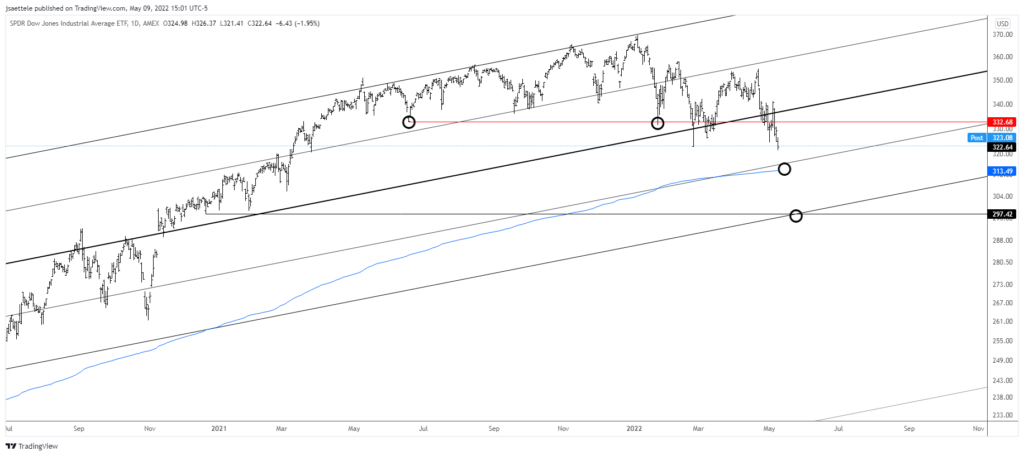
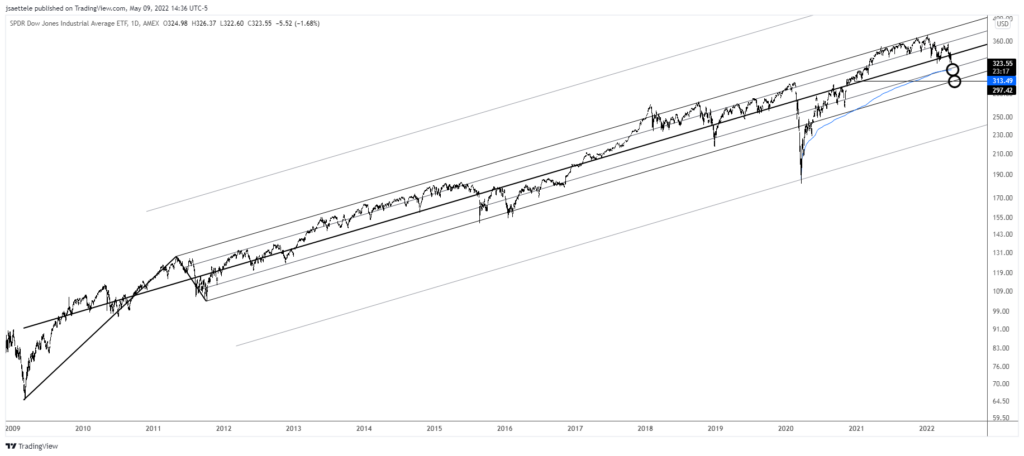
DIA (Dow ETF) levels are extremely well-defined. A massive top is completed and the biggest level on this chart is 297.50 (or so). A drop to that level would represent a 20% drop from the all-time high. In the grand scheme of things, that’s fairly normal. Possible trading levels before then include 313.50 (VWAP from the March 2020 low) and 332.70 for resistance (former support). The full view of the structure from the 2020 low is shown below.
5/5 – Today’s Dow move is important because price plummeted from the center line of the Schiff fork that originates at the 2009 low. In simpler terms, this line has been key support and/or resistance for years (note the highlighted areas…zoomed in chart is below). Consider the market in dangerous territory while price is beneath this center line.
DIA DAILY
BTCUSD DAILY
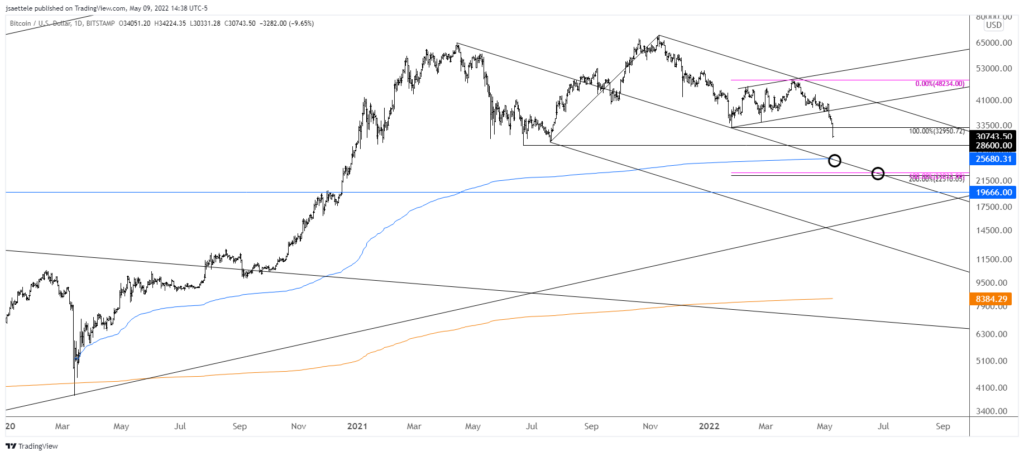
BTCUSD has fallen off of a cliff and there doesn’t appear to be bigger support until 25680. This is both VWAP from the March 2020 low and the median line from the fork that originates at the April 2021 high (what a difference a year makes!).
U.S. 30 YR YIELD WEEKLY
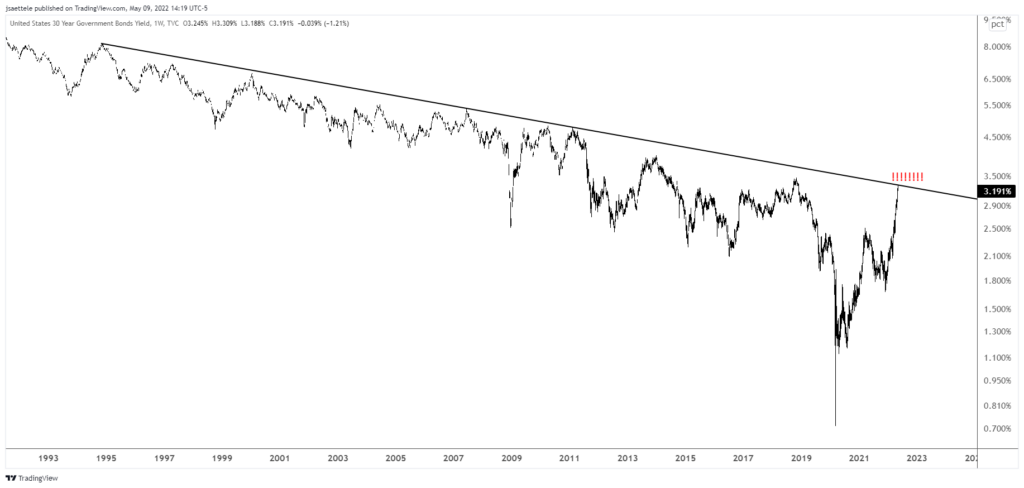
The 30 year U.S. yield traded 3.309% today before fading back. Today’s high was right at the 28 year trendline (to the tick). We did get a key reversal on TLT but volume was just slightly above average. In any case, one has to start thinking about long bonds here (yields declining) and consider the potential that the next market phase is traditional risk-off (bonds up, stocks down, Yen up, etc).
SPOT GOLD DAILY
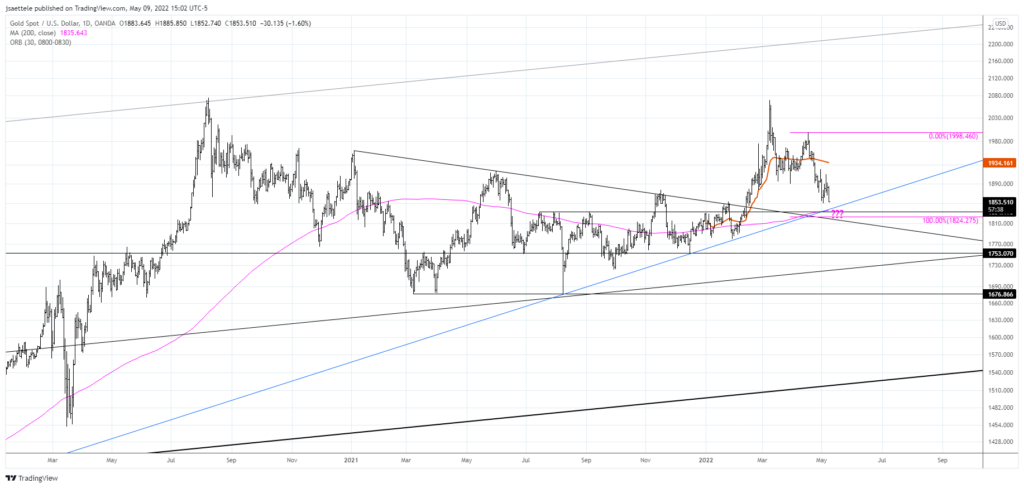
Pay attention to gold as it’s closing in on the key 1824/35 zone, which could produce a big low.
5/2 – Today’s gold dump opens up 1824/34. This level is massive. It’s the 200 day average, trendline from 2018, top side of former trendline resistance, and 2 equal legs down from the high. That level has to hold otherwise gold can’t be considered bigger picture bullish. Maybe gold is the ‘tell’ for the USD in that the metal finds support in the noted zone just as the USD tops.
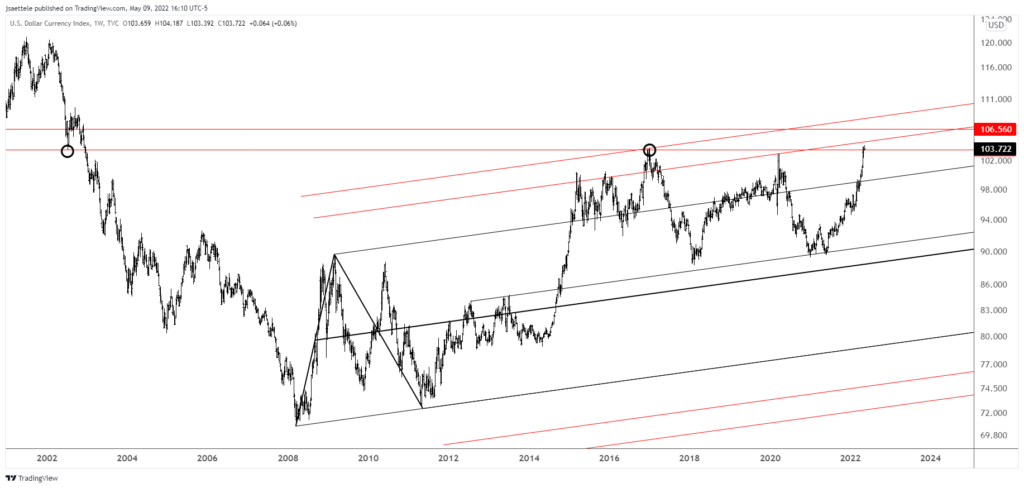
WSJ ‘DOLLAR STRENGTH BUCKS INFLATION WOES’

This WSJ from Sunday features a’USD fist’ lifting weights. If this were a magazine cover, then it would be a reliable sign of a top. As a newspaper article, this is a sign at a lesser degree. Even so, it’s indicative of extreme sentiment and price is at a level that’s been key for decades. The chart below highlights the level just above 104, which was the 2017 high and July 2002 low. The USD may have higher to go over the long term but markets don’t typically clear such a massive level on the first attempt.
5/3 – USD headlines are getting more interesting by the day. For example, a Bloomberg article today described USD strength as ‘hideous’. See here. I do wonder if FOMC ends up being a ‘sell the news’ event. This would manifest in a USD spike and reversal. Keep and eye on 104.70.
DXY WEEKLY
USDJPY 4 HOUR
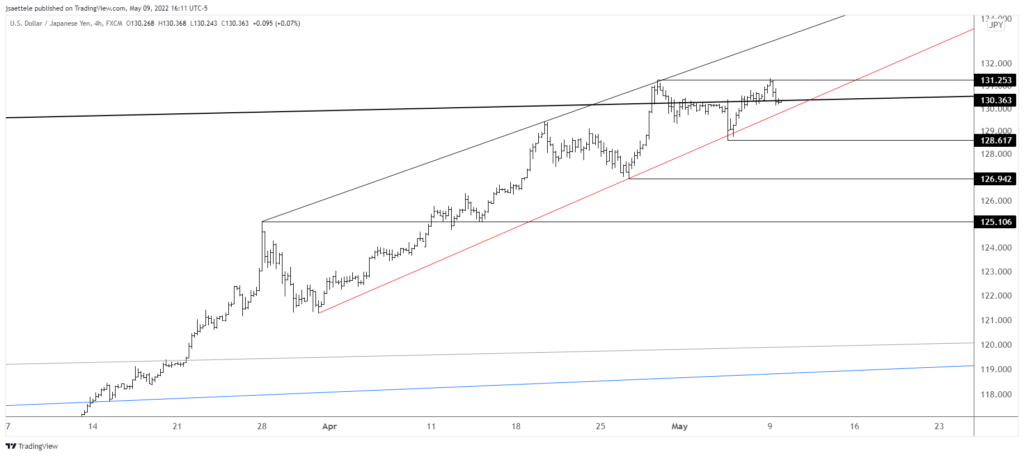
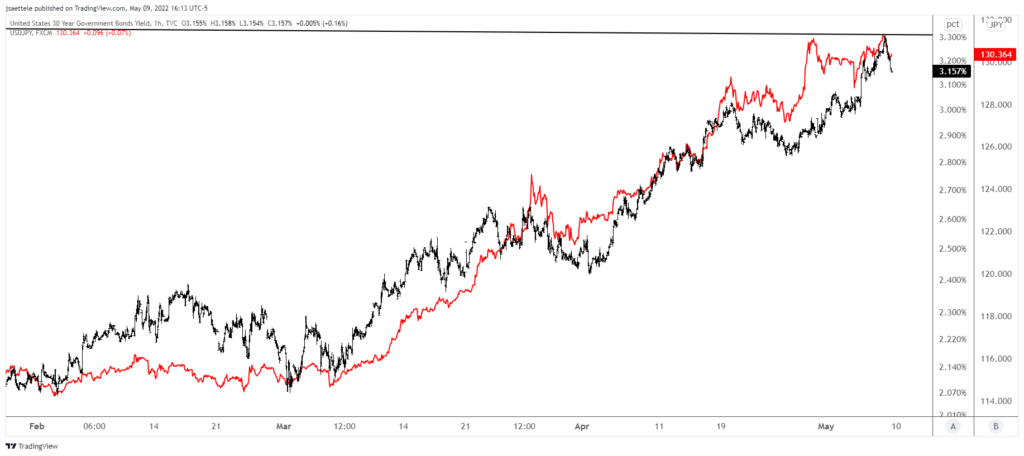
The line off of lows in March and April for USDJPY is the breakdown level. This line was support after FOMC last week so consider the line ‘verified’. A drop below opens up a possible double top with recent highs and finally the potential for a much needed counter trend move. Also, the possibility of a ceiling (at least for a while) in yields adds to the USDJPY short intrigue. Bond yield and USDJPY is below.
Do you make a profit trading USD/JPY?
Try our funded trader program and get up to $1,000,000 in funding.
Learn more
USDJPY (RED) AND 30 YR U.S. YIELD (BLACK) HOURLY
AUDJPY HOURLY
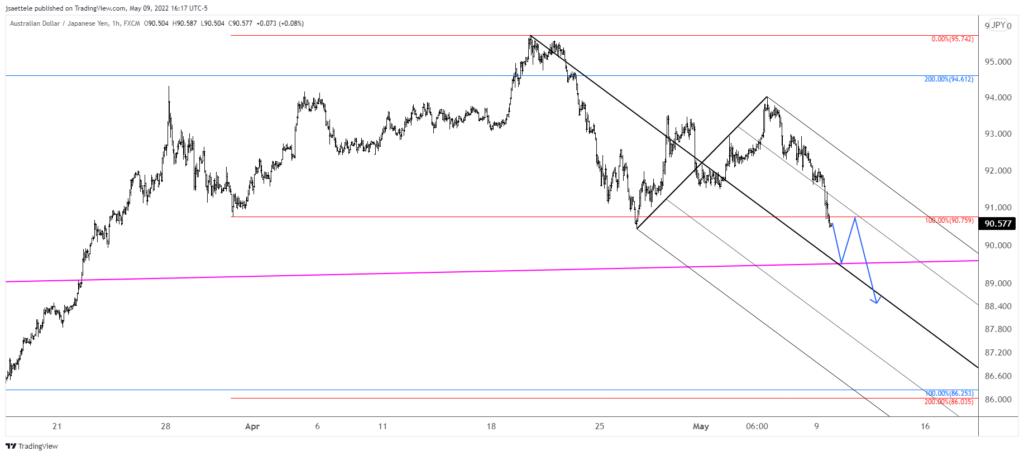
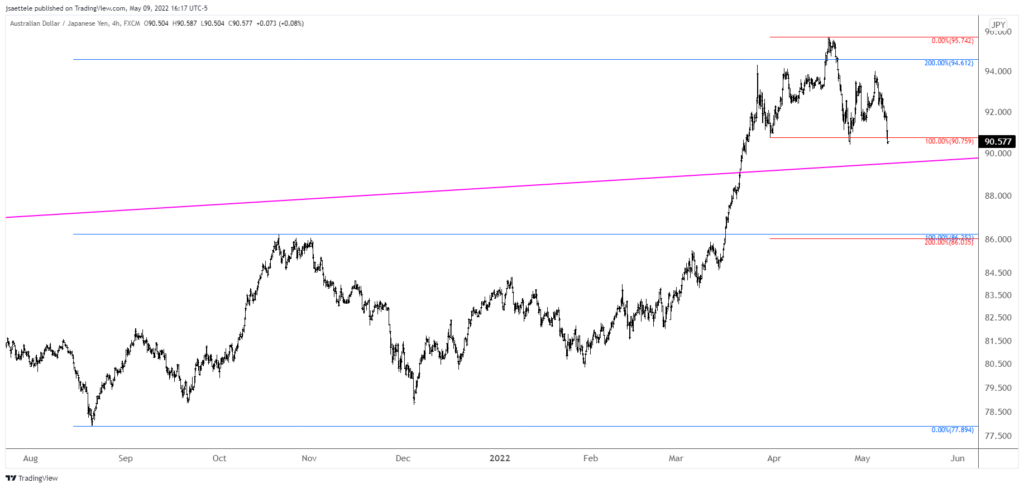
AUDJPY is pressing the neckline from a nearly 2 month topping pattern. The objective from the pattern is 86. A possible near term path is outlined in which price resumes lower in order to test a short term median line before a bounce materializes. The short opportunity would be on that bounce with resistance near 90.75.
AUDJPY 4 HOUR
