Market Update 12/8 – USDOLLAR Channel Break
USDOLLAR 4 HOUR
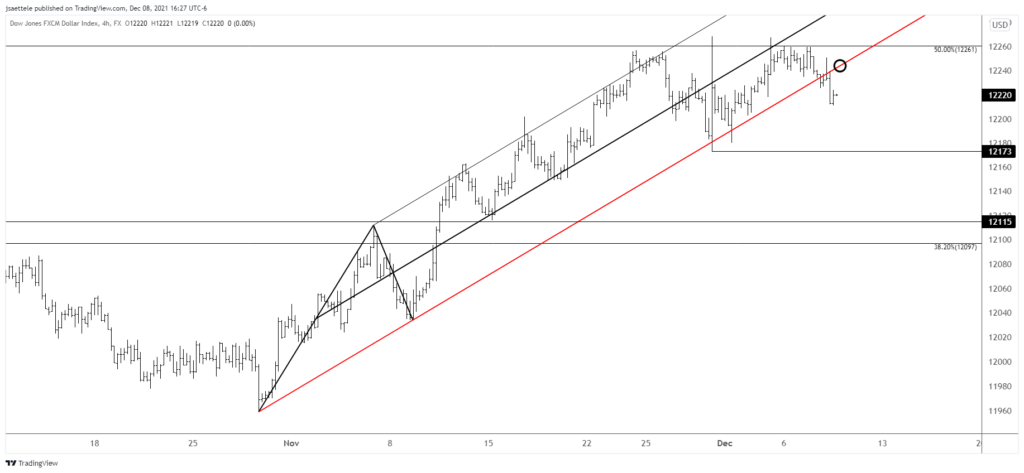
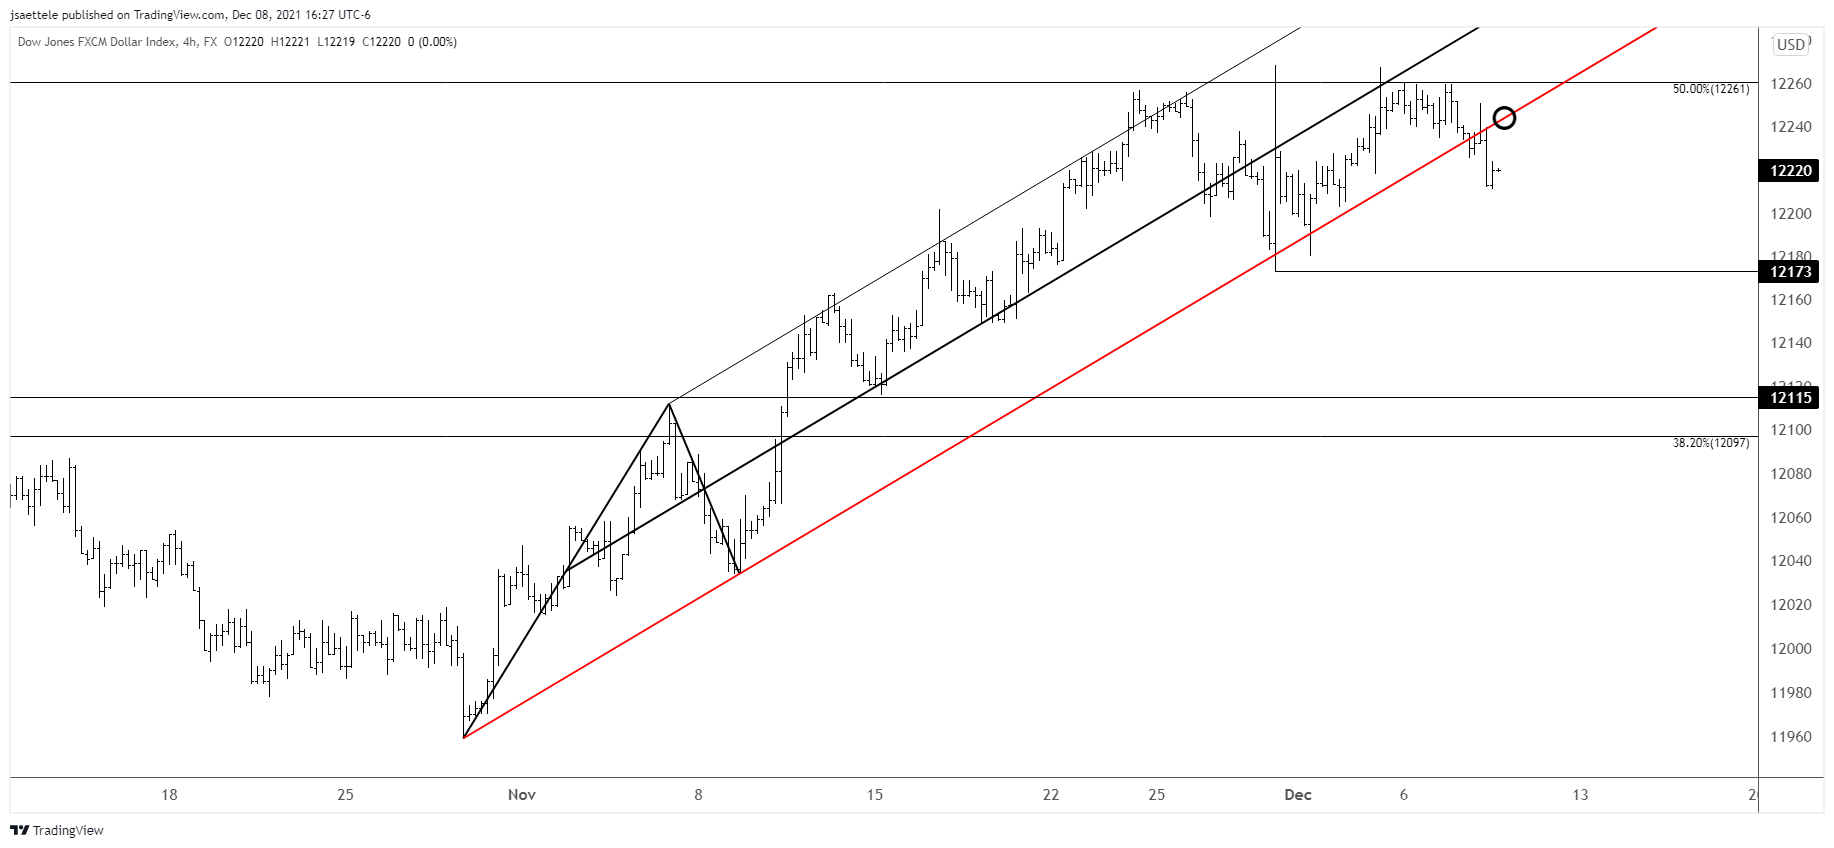
USDOLLAR broke the channel! The development suggests that the broader trend is lower. If ‘lower is legitimate’ then the underside of former channel support should provide resistance near 12245. We’ll worry about downside levels of interest as the situation evolves.
12/7 – All eyes should be on the month+ USDOLLAR channel line. As noted last week, a break below would serve as the trigger that the USD has finally turn
DXY 4 HOUR
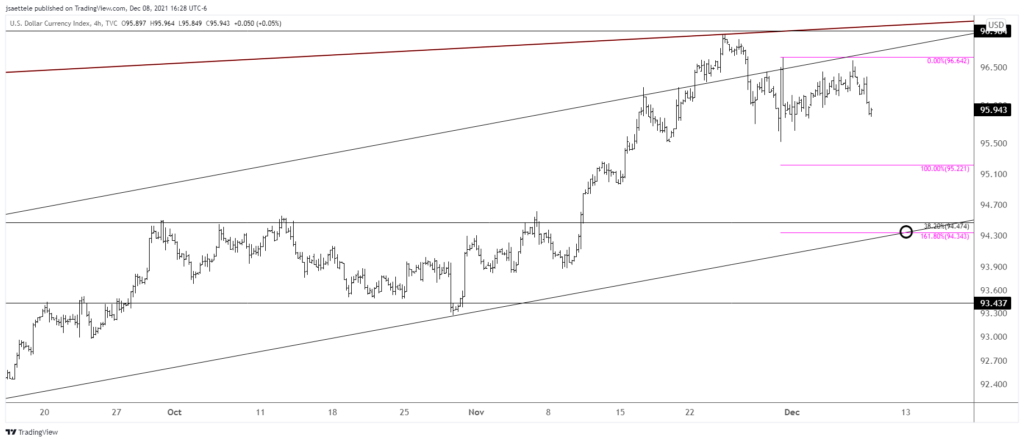
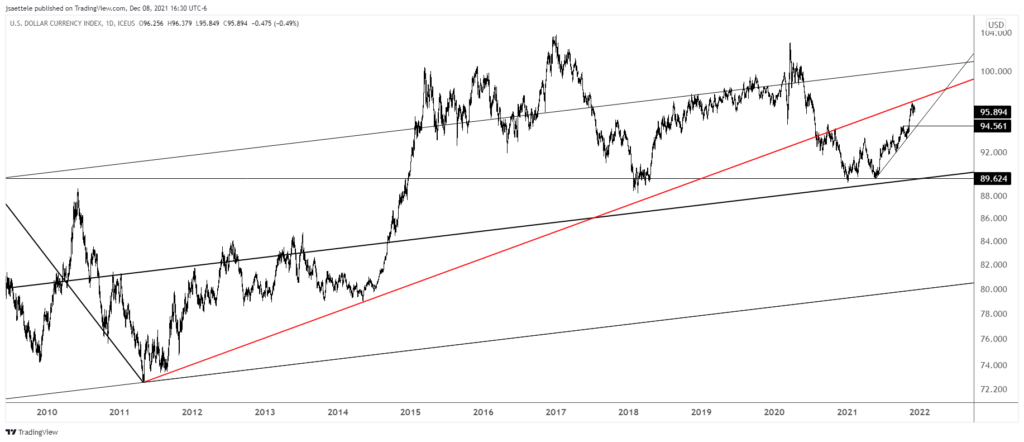
Everything from the 11/30 note remains valid. It’s been 2 weeks since the top but feels much longer (to me at least). I know this ‘feeling’ and it suggests that the relative brief passage of 2 weeks is inordinately important…think power laws. Perhaps anticipation emphasizes the importance of this recent moment in time. Bottom line, violent downside wouldn’t surprise. Downside focus remains 93.30/50 with 95.20s as a possible bounce spot. The longer term chart is below.
11/30 – The DXY high is right on the trendline that was pointed out last week (see chart below for the full picture)…we may have just seen a major top. Trading wise, I’m looking towards 93.30/50 with 95.20s as a possible bounce level. The lower zone is channel support. That will be the big test. If DXY is a bear then 96.20s should provide resistance.
DXY DAILY
EURUSD 4 HOUR
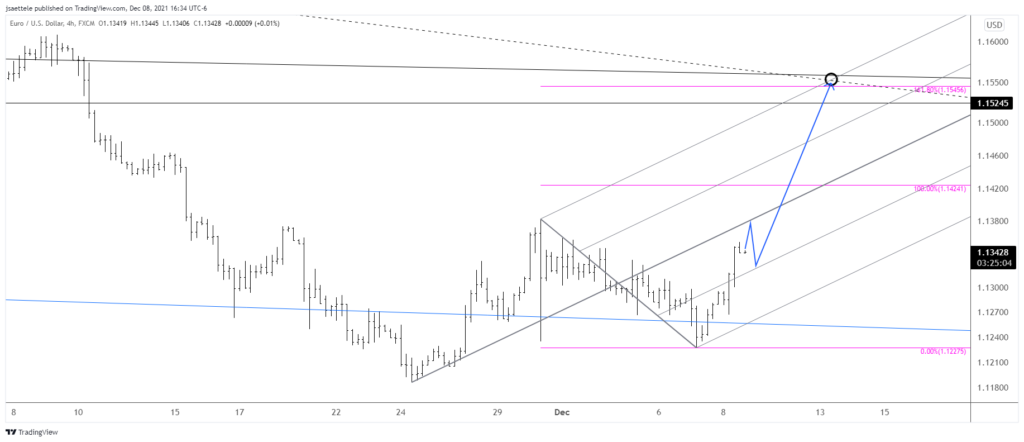
My stance towards DXY is of course applied to EURUSD (reciprocated). I’m a bull and still looking towards 1.1520/50. A possible path is outlined in which price tags the 11/30 high before pulling back to reset before surging higher. Note that extreme moves are a December hallmark. Watch for 1.1315 support.
11/30 – Remember that long term trendline (blue line…see full picture below) that was support on 11/17? I’m of the mind that price is basing around this line. The weekly chart below also shows weekly reversals (J-Spikes…price based only) at one year lows/highs. There are false signals of course but there are also a lot of great signals. I’m looking towards 1.1520/50 with a possible hiccup near 1.1430. If EURUSD is a bull, then 1.1287-1.1300 should provide support. The top of this zone is the week open.
ETHUSD 4 HOUR
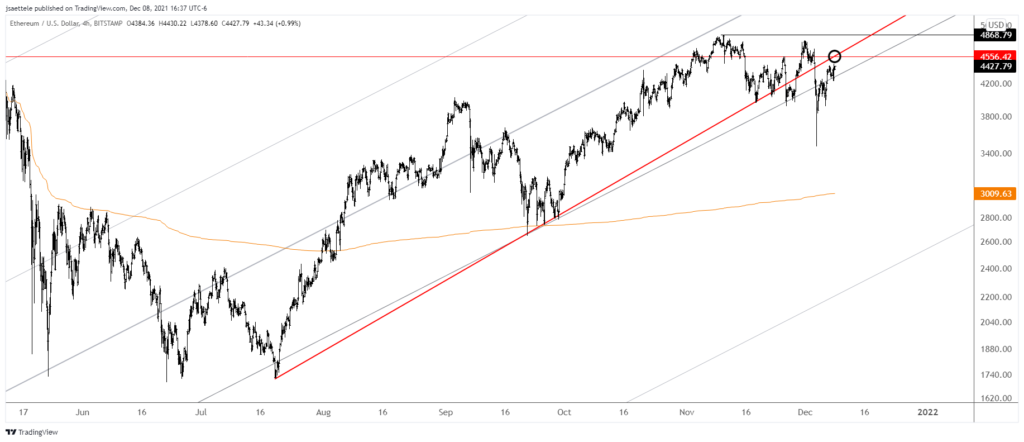
The only thing to add to the comments from Sunday are that proposed resistance is the underside of the trendline that originates at the July low. That line is about 4570.
12/5 – ETHUSD is in a dangerous spot. Price broke trendline support over the weekend before snapping back. Price is right at the underside of that trendline now so beware of downside resumption. In the event of a spike higher (trap) watch the 50 and 200 period averages on the 4 hour chart for resistance in the 4350-4420 zone. An aggressive downside target is near 2200. A longer term view is below.
DOGUSD DAILY
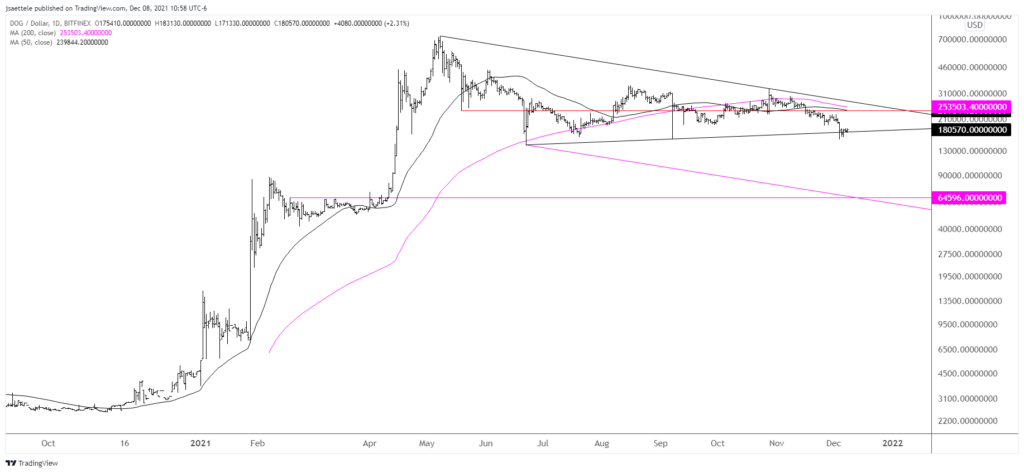
Let’s finish today’s post with some ‘crap coins’!
DOGUSD is testing the lower boundary of a 7 month descending triangle. The descending nature of the triangle suggests that price will ultimately resolve to the downside. Still, respect bounce potential as long as support holds. In the event of a rally, the 50 / 200 day average confluence is proposed resistance near 253500. A measured objective on a downside break is about 64600. This level is 2 legs down from the May high (log scale…the initial decline was 80%…an 80% decline from the lower high in October would be about 64600).
DOTUSD DAILY
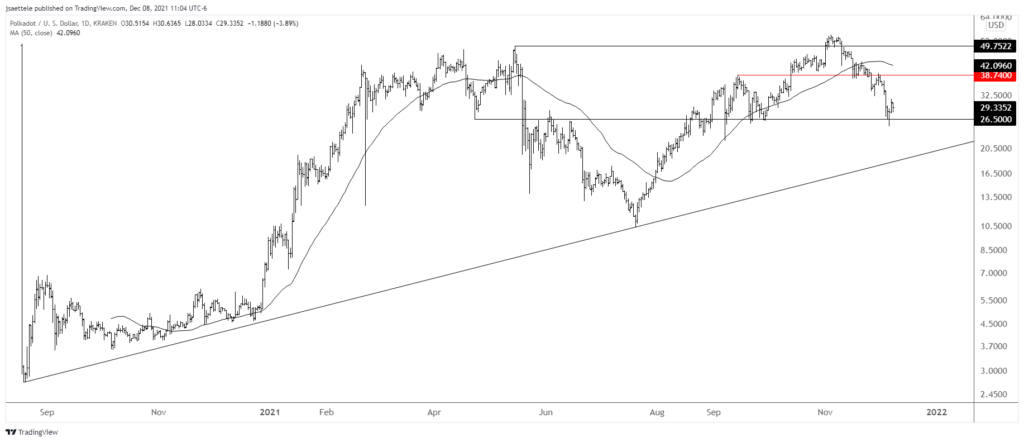
DOTUSD has responded to the well-defined 26.50 level. As long as this holds, respect rally potential back to 38-39. The 50 day average, which has served as an extremely useful trend filter since inception, is currently just above that level. The next downside level of interest is the life of asset trendline near 19. If that breaks, then simply consider DOTUSD broken.

