Education
- Filter by
- Categories
- Tags
- Authors
- Show all
- All
- About
- Accounts
- Articles
- Company News
- Cryptocurrency
- Education
- Forex
- Funding
- HFT
- Institutional
- Interviews
- Money managers
- MT4
- News and Analysis
- Partnerships
- Uncategorized
- White label
- All
- $GME
- Abe Cofnas
- account
- ADA/USD
- ADP
- alert
- Alpesh Patel
- Analysis
- Andrew Pancholi
- Apple
- Arif Alexander Ahmad
- ASHR
- asset manager
- AUD/CAD
- AUD/JPY
- AUD/USD
- AUDDollar
- Aussie
- australian dollar
- Automated Trading
- Bank of England
- Bitcoin
- Bitcoin Halving
- Boris Schlossberg
- Bow Sailing
- bradley Rotter
- Brexit
- BRITISH POUND FUTURES
- BritishPound
- broker
- BTC/USD
- CAD/JPY
- CANADIANDOLLAR
- capital
- charity
- Charting
- China
- CLDR
- Client Service
- Commodities
- Commodity
- community
- Company News and Events
- Copper
- Copy Trading
- Coronavirus
- corporate responsibility
- corporate social responsibility
- COVID
- COVID-19
- Crude Oil
- CRYPTOCOIN
- Cryptocurrencies
- CTA/USD
- cTrader
- currency
- Currenex
- Cycles
- Daily Analysis
- Dan Blystone
- Daniel Hunter
- DDQ
- DIA
- DJI
- DJIA
- DOCU
- DOG/USD
- Dogecoin
- Dollar
- DOT
- DOT/USD
- Dow
- DUTCH
- DXY
- Employment Report
- ES
- ETF
- ETH/USD
- Etienne Crete
- EUR/AUD
- EUR/CAD
- EUR/CHF
- EUR/GBP
- EUR/JPY
- EUR/USD
- Euro
- event
- fake
- Family Offices
- FED
- Federal Reserve
- Fibonacci
- Finance Magnates
- firm
- Fiscal Stimulus
- FIX API
- FOMC
- Forex
- Forex Education
- Forex Investment
- Forex Market
- Forex Mentor
- Forex Scam
- Forex Valhalla Initiative
- ForexCrunch
- ForexLive.com
- Francesc Riverola
- Francis Hunt
- fraud
- fund manager
- Fundamental Analysis
- funded
- funded trader
- funded trading
- FXCopy
- FXE
- FXStreet
- FXY
- GameStop
- Gaming
- Gann
- GBP
- GBP/AUD
- GBP/CAD
- GBP/JPY
- GBP/USD
- GLD
- Gold
- hedge fund
- high net worth individuals
- High-frequency trading
- Hugh Kimura
- Ideas Stream
- Inflation
- institutional traders
- Interest rates
- Interview
- investment
- investor
- James Glyde
- Jamie Saettele
- JapaneseYen
- Jim Rogers
- JJC
- journey
- JPY
- Kiana Danial
- KIWIDOLLAR
- leadership
- Lifestyle
- Liquidity
- London
- Lumber
- MAM
- Market Analysis
- Market Update
- Median Line
- Medium
- MetaQuotes
- MetaTrader
- Michael Buchbinder
- mindfulness
- Money Manager
- MT4
- MT5
- Myfxbook.
- NASDAQ
- news
- NFP
- NIKKEI
- NIKKIE
- NOK/JPY
- NZD
- NZD/JPY
- NZD/USD
- NZDDOLLAR
- Oil
- Online Education
- Pandemic
- performance
- Podcast
- Polkadot
- Pound
- pro trader
- Professional Trader
- professional traders
- prop
- prop firm
- prop trader
- prop trading
- Psychology
- QQQ
- Regulation
- Risk Management
- Russia
- S&P
- S&P 500
- S&P 500 Futures
- Sanctions
- Scandex
- Scandinavian Capital Markets
- Scandinavian Exchange
- security
- Short Squeeze
- Silver
- Simon Ree
- SLV
- SOL/USD
- SPOT
- SPOTSILVER
- SPX
- SPY
- Steve Ward
- Stock Market
- Stockholm
- Stocks
- Stop Loss
- Sweden
- Swedish Broker
- The Economist
- Thought Leadership
- Tim Racette
- tips
- TLT
- Trade War
- trader
- Traders
- traders community
- Trading
- Trading Analysis
- Trading Career
- Trading Journal
- Trading Pairs
- Trading Psychology
- trading Signals
- Trading Strategies
- Trading Strategy
- Trading Technology
- Trading WTF
- Tradingview
- Transparency
- Trump
- Trust
- TULIP
- Turkish Lira
- U.S. 30 YR
- US Dollar
- US10YR
- USD
- USD/CAD
- USD/CHF
- USD/CNH
- USD/JPY
- USD/MXN
- USD/NOK
- USD/RUB
- USD/SEK
- USD/TRY
- USD/ZAR
- USDOLLAR
- USO
- UUP
- Valhala
- Valhalla
- Valhalla Alumni
- Volatility
- War
- wealth
- wealth management
- webinar
- White Label
- Women traders
- Wood
- XAG/USD
- XAU/USD
- XLK
- XLY
- Yen
- Young Traders
April 22, 2022
April 22, 2022
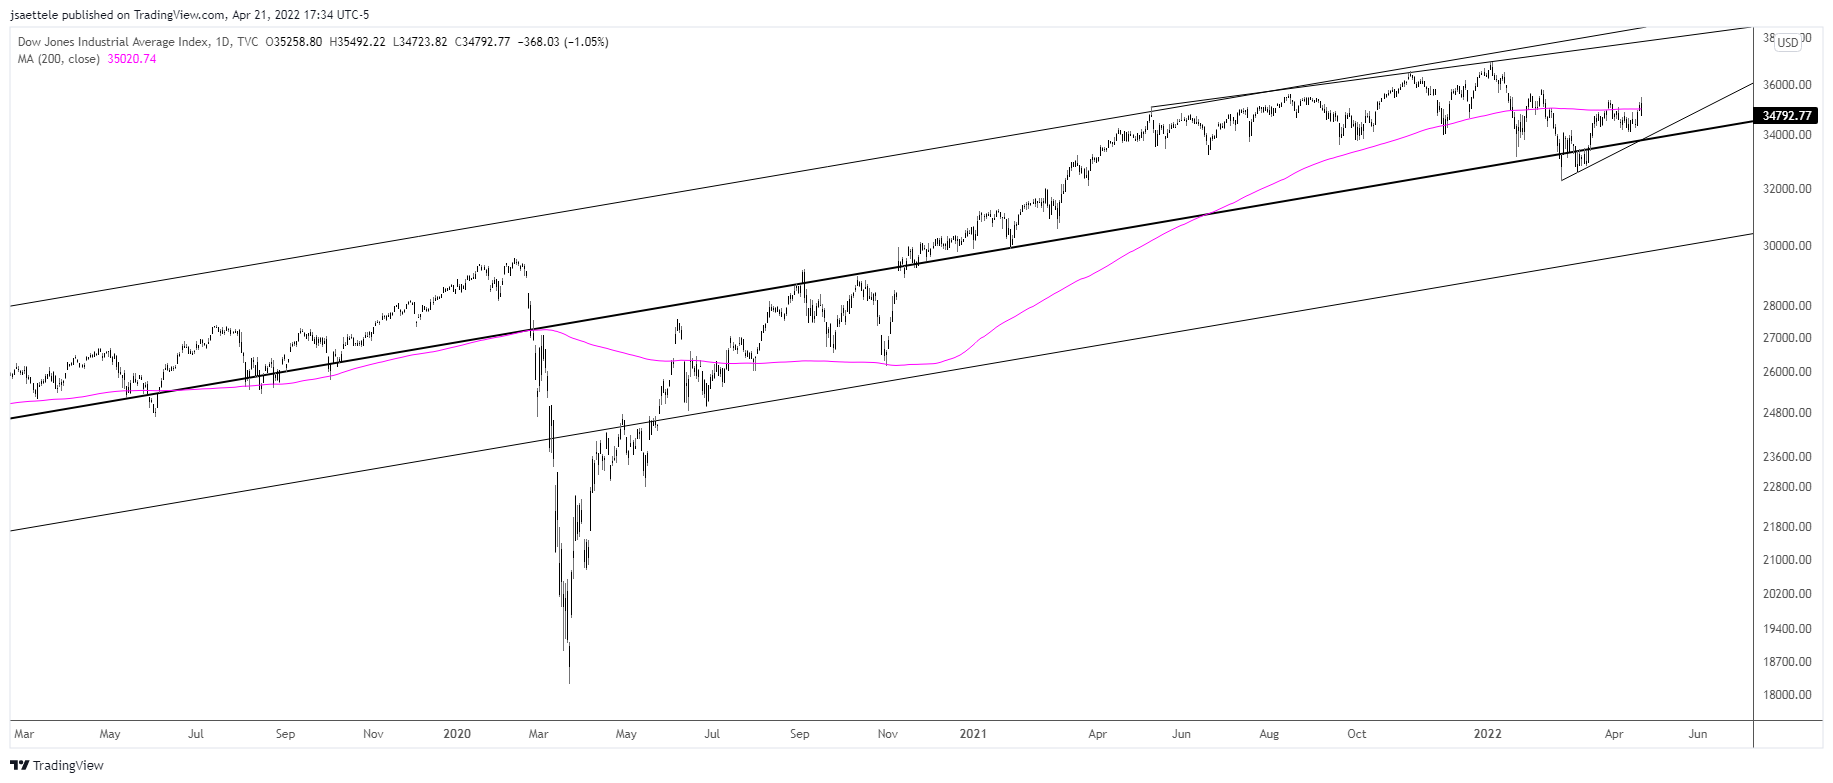
The Dow traded to its best level since 2/10 today before plummeting all day and forming a massive bearish outside day in the process. Scroll out and you’ll see that price has been pressing against a flat 200 day average as well. I’m wondering if this is a larger trend change. It’s safe to say that the broader trend has shifted from up to sideways. If price breaks the long term center line then the trend will be considered down with focus on 29800 or so. The full picture from the 2009 low is below.
April 22, 2022
March 11, 2022
March 11, 2022
AUDJPY action since last May is an ascending triangle. The pattern portends a bullish outcome. What’s more, the cross is historically a decent barometer of risk appetite. Well, equities have been slammed for months yet AUDJPY is pressing the highs. This alone is reason to suspect an imminent breakout. A breakout occurs above 86 and would target the September 2017 high at 90.30 initially.
March 11, 2022
March 4, 2022
March 4, 2022
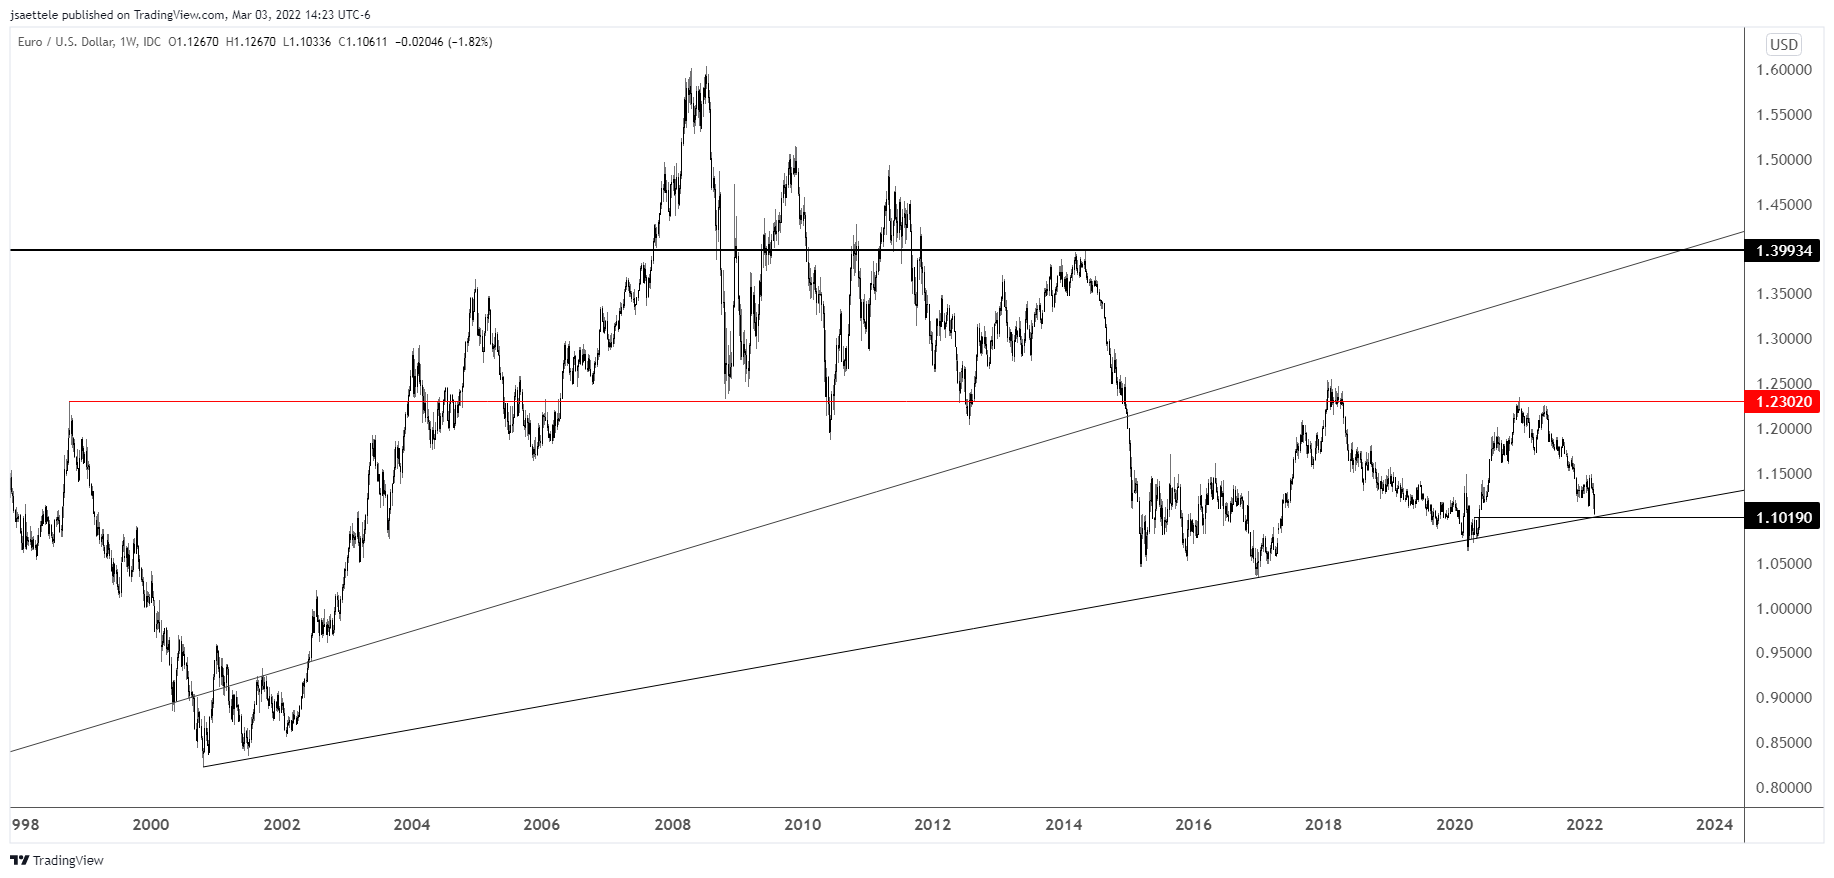
Consider today’s update the ‘long term trendline edition’. NFP is tomorrow and I’ve witnessed many turns from stretched markets over the years following an NFP spike. In this instance, that would be a spike towards USD strength (EURUSD weakness). Interestingly, EURUSD is closing in on a 22 year trendline! This is the same trendline that was support for the 2020 low. A close up is below…the trendline is about 1.1000/20. This is also the 78.6% retrace of the rally from the 2020 low.
March 4, 2022
February 22, 2022
February 22, 2022
CADJPY is nearing the bottom of the 2022 range. Weakness below the 1/24 low would leave a series of lower highs and lower lows since the January high although 2 legs down from that high is possible support at 89.12. The bigger level is the 161.8% extension, which intersects the lower parallel of the channel from the March 2020 low at 87.55. 90.40/60 is resistance. A zoomed out chart is below.
February 22, 2022
January 21, 2022
January 21, 2022
SPX printed 4447 after the close. This is a good spot for a bounce, especially given elevated volumes in SPY and QQQ today. The red bars on the charts below indicate when the volume is at least 1.5 x the 20 day average at a 50 day low. The market usually bounces following one of these high volume days, although there are of course exceptions. My ‘favored’ view is that price bounces but that the bounce fails near 4530.
January 21, 2022
January 20, 2022
January 20, 2022
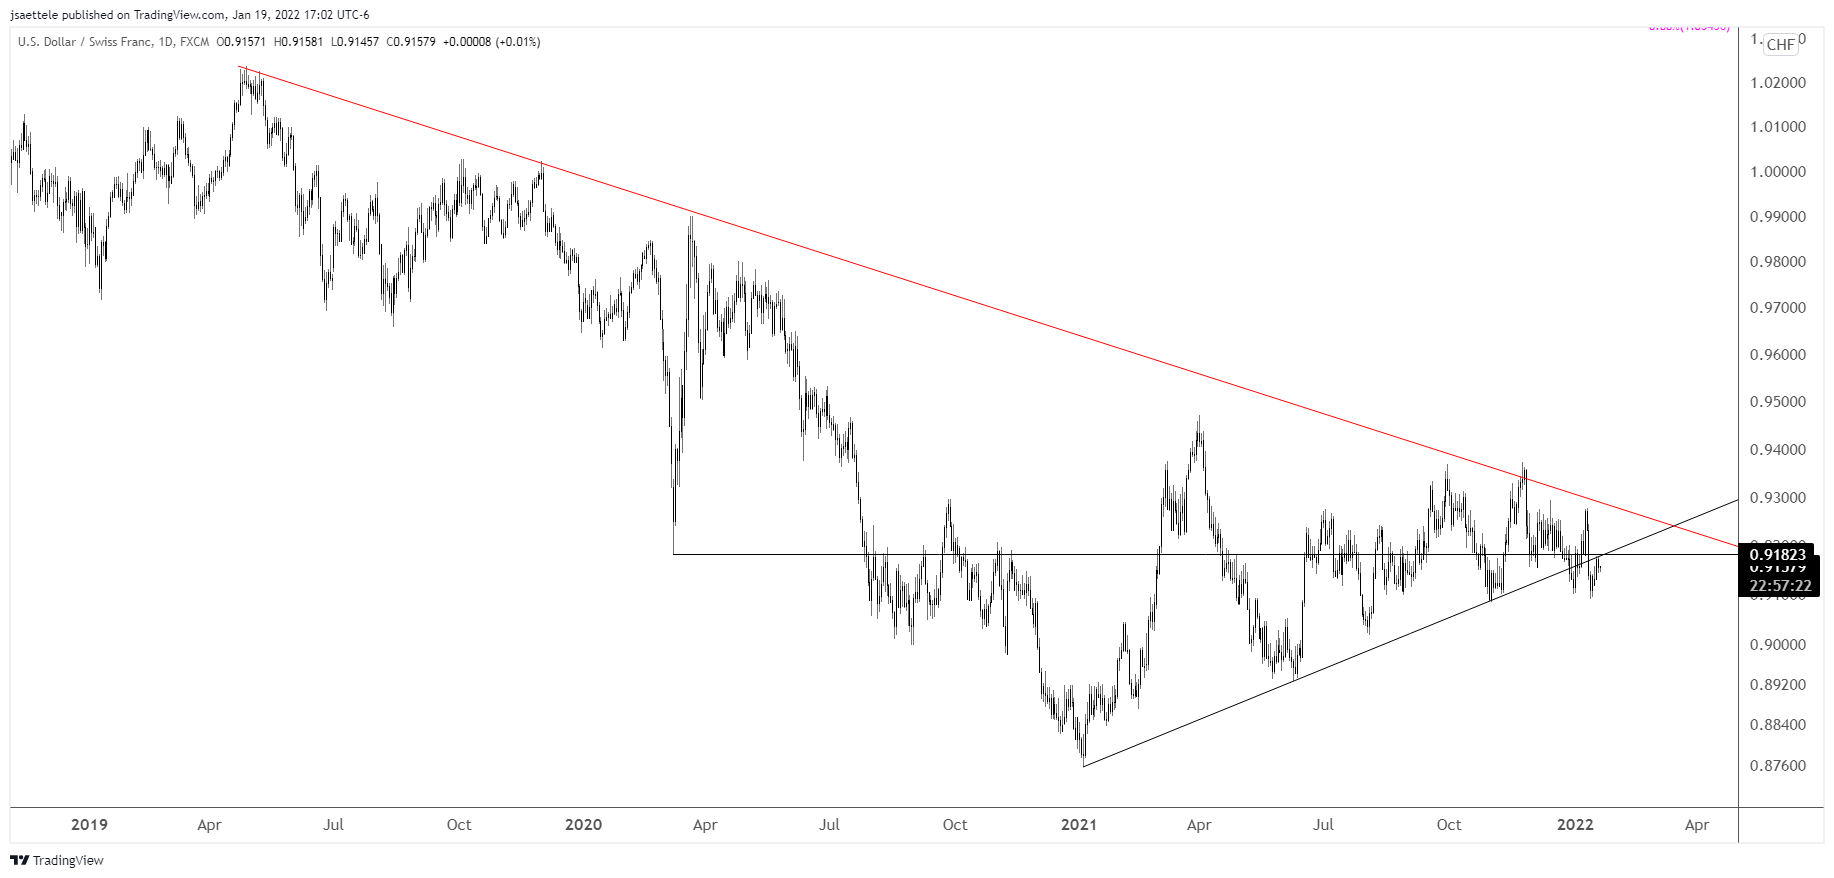
Is USDCHF about to get destroyed? After failing at a 2+ year trendline in late 2021, price has broken a year long trendline and now re-tested the underside of the line the last 2 weeks. This chart is extremely bearish.
January 20, 2022
January 11, 2022
January 11, 2022
NQ broke the channel from the March low today but sharply reversed higher, putting in a high volume reversal in the process (see below chart). Watch the underside of the channel for resistance now near 15750 but the reversal casts doubt on that level as resistance. Proposed support is 15400. If this is a bigger top then both sides probably need to be frustrated…that’s how distribution works!
January 11, 2022
January 6, 2022
January 6, 2022
ETHUSD has broken the line described yesterday (magenta line). This line is resistance if reached near 3640. Price is testing the 200 day average now (not shown) but the more important level is probably VWAP from the May 2021 high at 3050 (see below). Bigger picture, my view is that price drops to 985 or so in a 4th wave.
January 6, 2022
November 17, 2021
November 17, 2021
BTCUSD has followed through on its 11/10 reversal. I love this setup. Price has broken the median line, which is now proposed resistance along with the 11/12 low at 62295. Initial downside focus is channel support (blue line) in the 52000s. A longer term view is below.
November 17, 2021


