Education
April 25, 2022
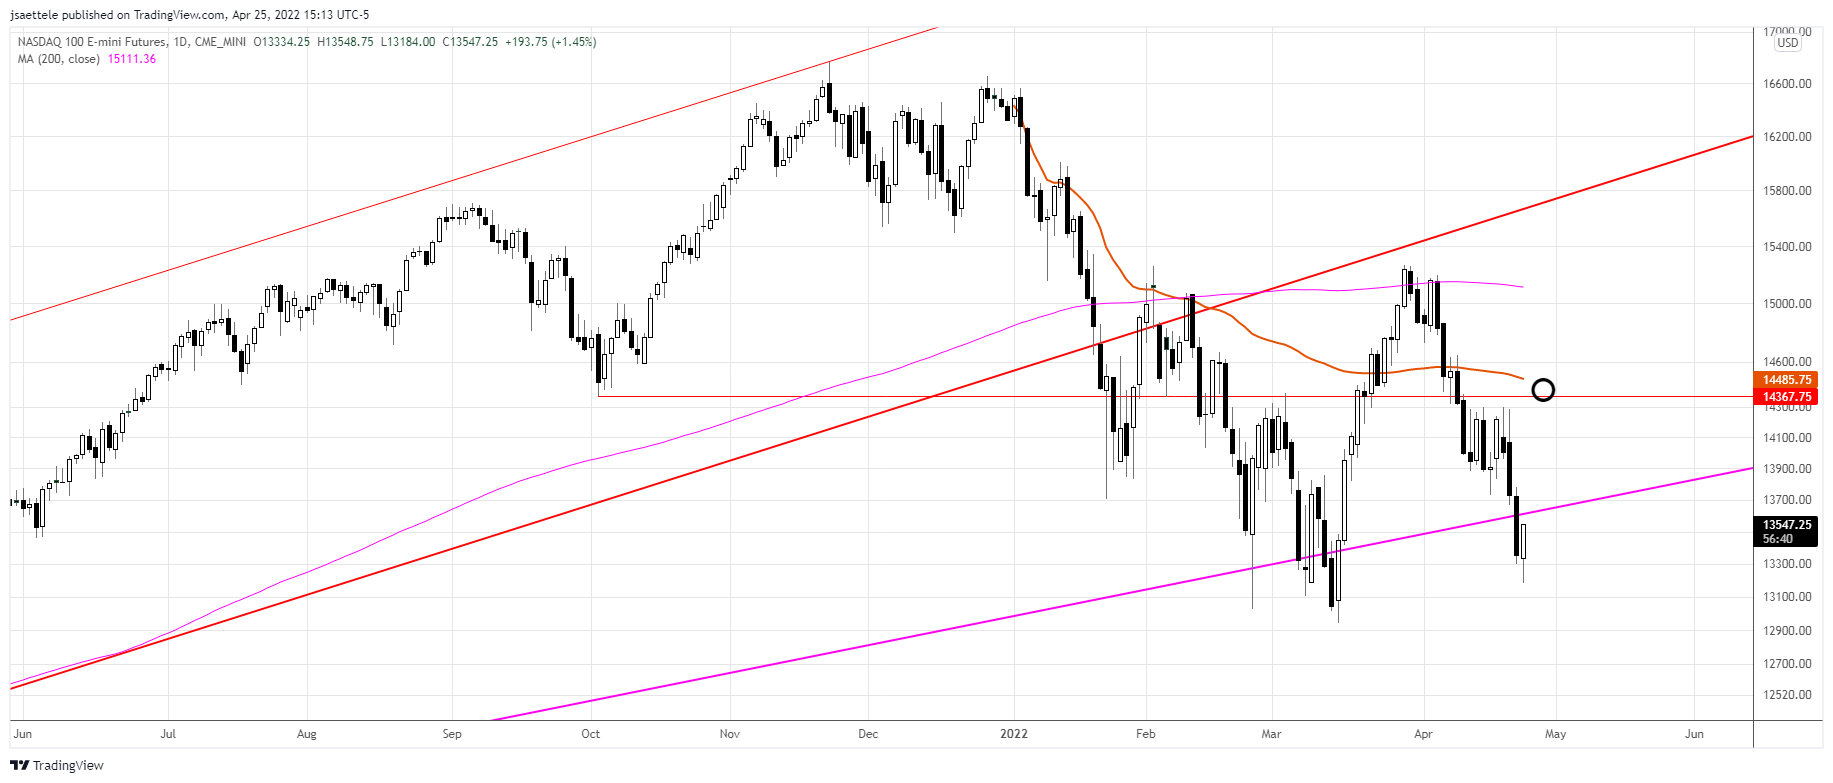
The Nasdaq is holding on for dear life. Price continues to trade around the well-defined trendline that crosses highs over the last 8 years (see zoomed out chart below). Bigger picture, one must acknowledge that trend is sideways at best and possibly down with price below the 200 day average and that average shifting from a flat to a negative slope. Near term, today’s reversal sets up for a squeeze higher with resistance in the 14300-14500 range. A relief rally is needed in order to relieve extremely negative sentiment.
June 8, 2021
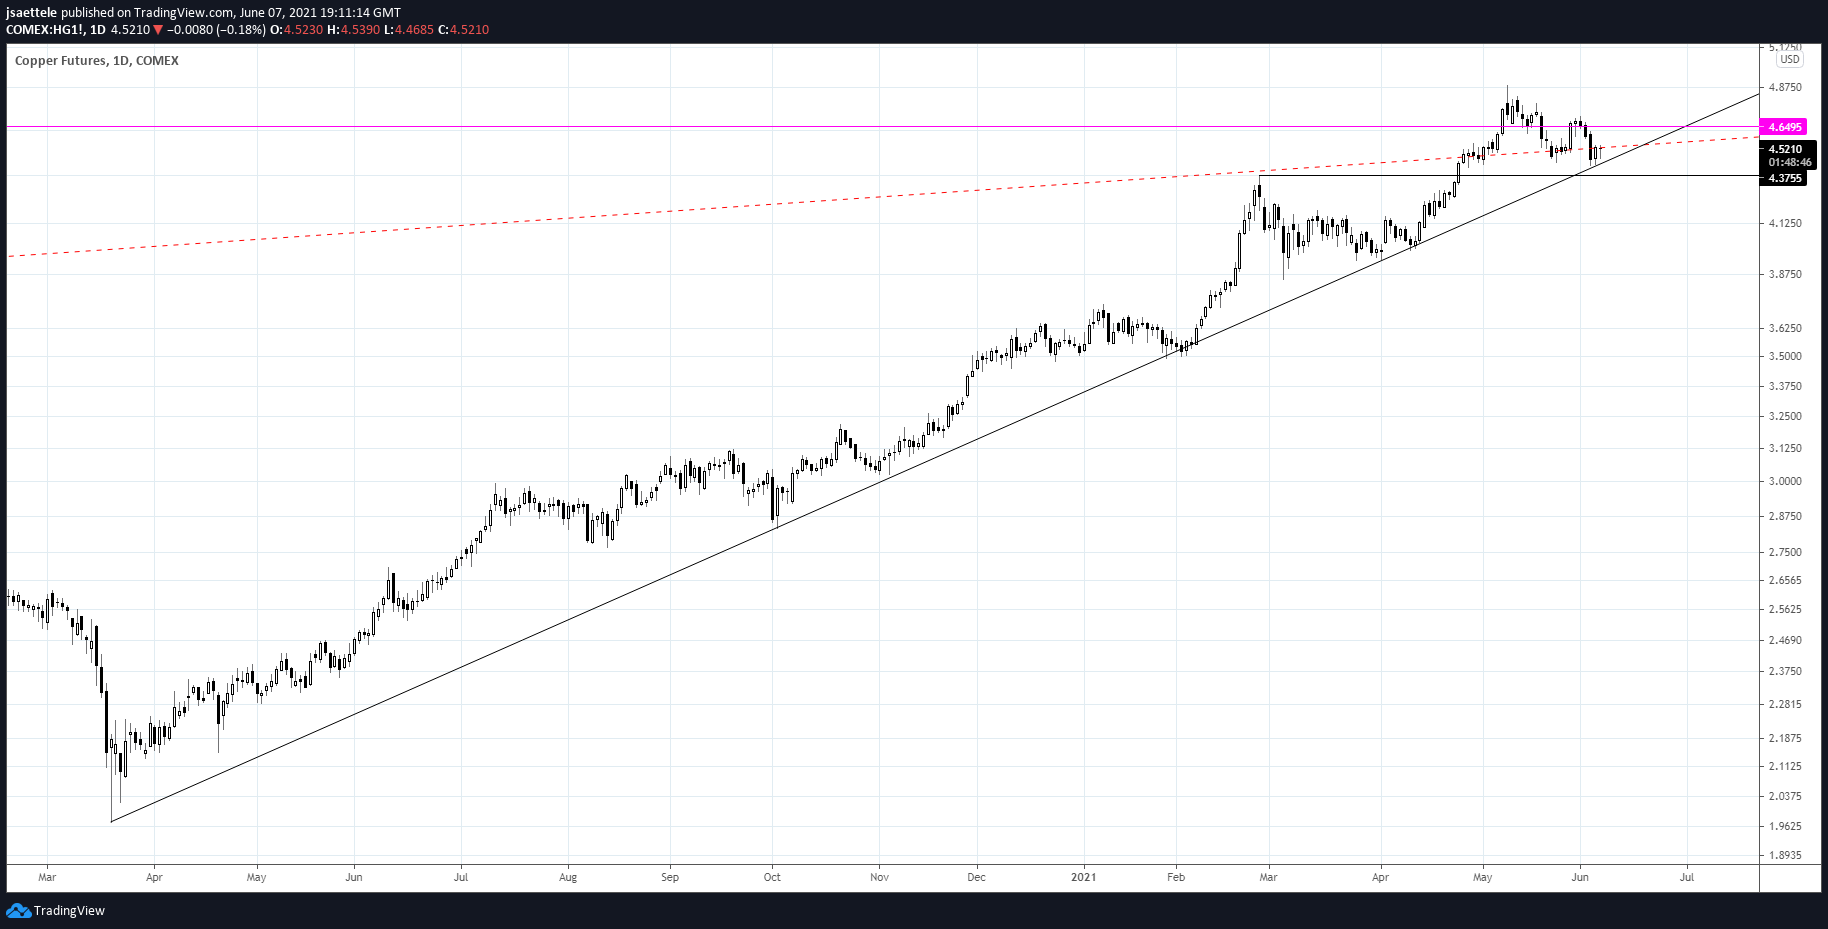
Copper is at 14+ month trendline support. A break below would indicate a significant behavior change and usher in the largest decline since the rally started in March 2020. The long term picture is below.
5/24 – After trading to an all time high 2 weeks ago, copper put in a weekly reversal candle. Price followed through on the downside last week as well. This raises the specter of a massive failure after the move above the 2011 high. A close up view is below.
June 3, 2021

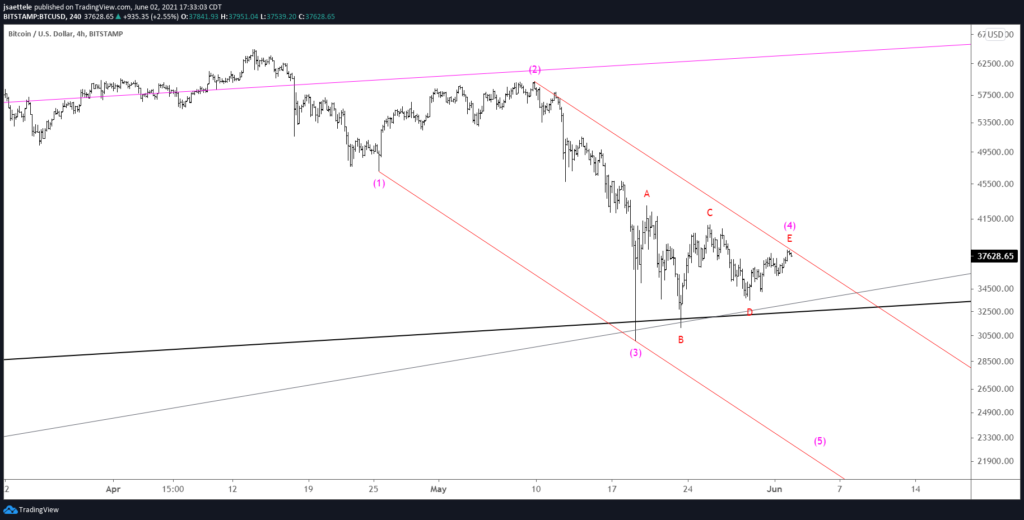
BTCUSD may have completed a 4th wave triangle within a 5 wave decline from the April high. The decline channels in perfect Elliott form and proposed wave 4 has traced out a well-defined triangle. If the proposed interpretation is correct, then BTCUSD is lower from the current level (this pattern negates above 40904).
5/19 – BTCUSD tagged the 32000 level (low was 30000) and snapped back but I don’t think this is the low. Notice where the snap back rally stalled…right at the underside of the former channel line (magenta channel). This is the ‘slingshot’ setup that I’m so fond of. If strength resumes then VWAP levels to know for resistance are 44400 (2021 VWAP) and VWAP from the top, which is currently 50000. The ultimate support is 19666, which is the 2017 high and the 25 line of the channel that we’ve been following. Recall that we turned bearish in February at the 75 line because the rally materialized at the 25 line. This is knows as median line symmetry (see daily chart below)!
May 27, 2021
The demise of the dollar? Reserve currencies in the era of ‘going big’.
BITCOIN AND THE DEATH OF THE US DOLLAR.
Markets oscillate between extreme optimism and extreme pessimism. The above headlines suggest that the USD is at/near a bearish sentiment extreme…and therefore a price bottom.
May 7, 2021

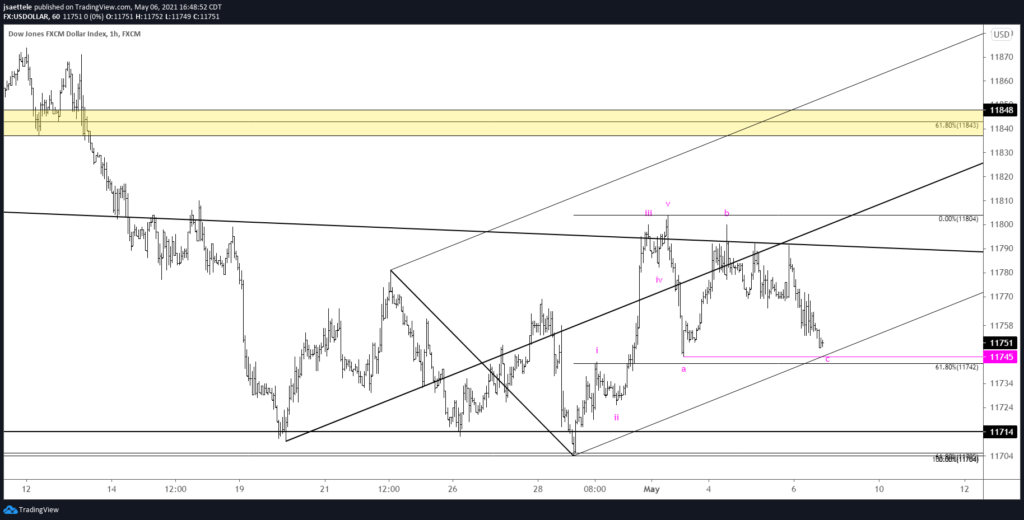
A print under 11745 in USDOLLAR will complete 3 waves down from the 5/3 high and give way to another leg up…at least that’s what I’m thinking. Reminder, NFP is tomorrow!
May 3, 2021

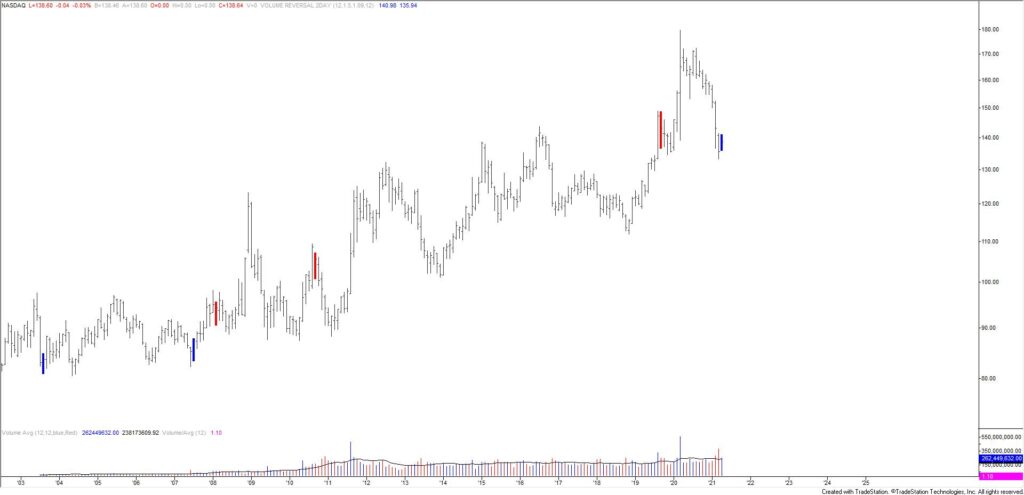
TLT completed a 2 bar monthly volume reversal in April. This is the 3rd bullish monthly signal ever. The first 2 (blue bars) nailed lows in August 2003 and July 2007.
May 20, 2020

We need look no further than Turkey to understand the potential disaster faced by countries unable to keep up with general obligations. With dwindling foreign reserves of any kind and hefty debt, the country is forced to turn to allies for help, including U.S. swap lines. With tourism effectively halted, the country faces a significant risk of defaulting on its obligations in the coming months.