Education
June 16, 2021

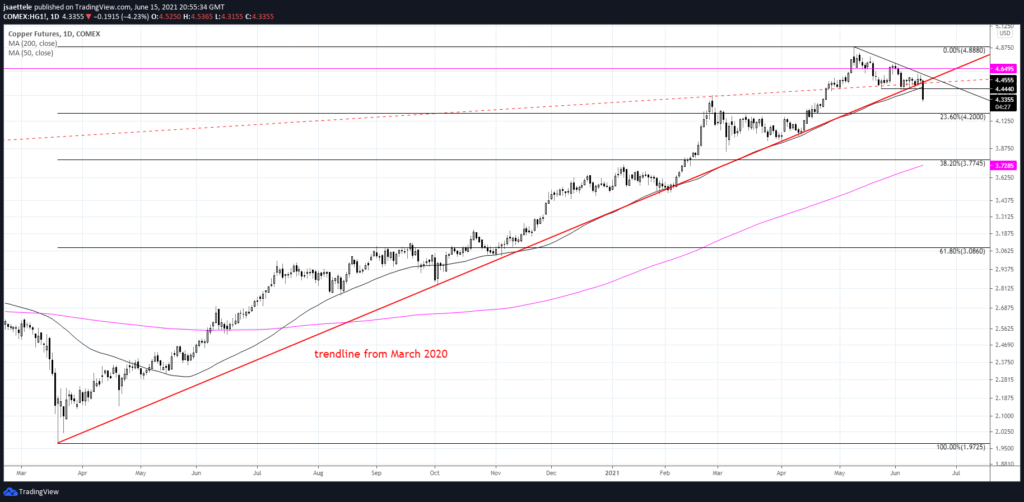
Copper broke today and the first level of interest on the downside is the 23.6% retrace of the rally from March 2020 at 4.20. This level coincides with resistance from this March. Former support at 4.4440 (also the 50 day average) is now proposed resistance.
June 11, 2021

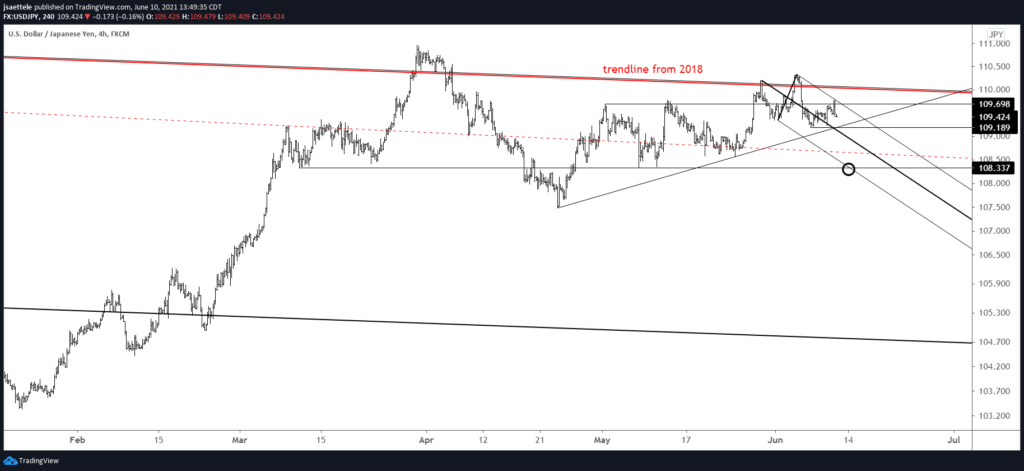
109.20 is the breakdown level in USDJPY now but there is a well-defined bearish fork in place and today’s high at 109.80 is at a well-defined horizontal level. As such, I’m bearish against today’s high and looking towards 108.34 initially.
June 4, 2021

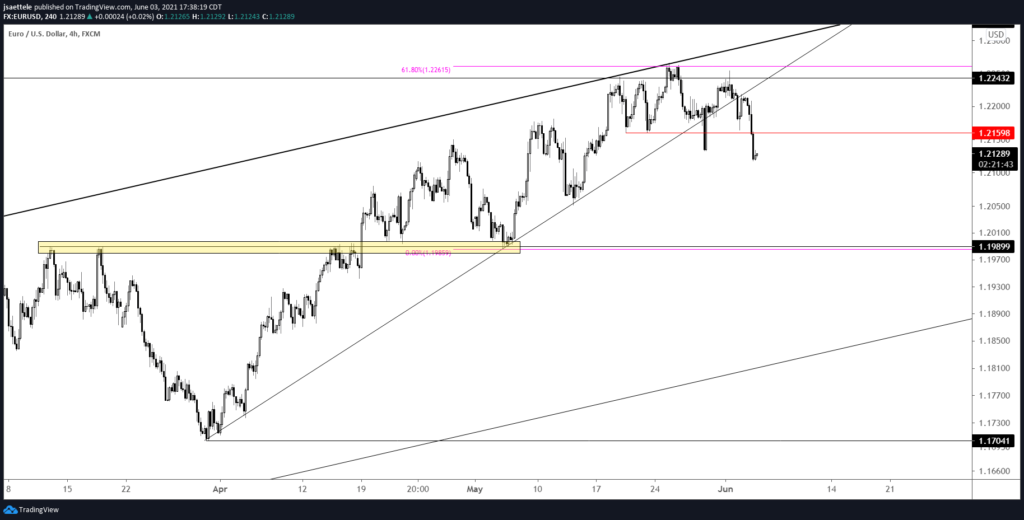
EURUSD has broken down and near term focus is 1.1990 (see highlighted zone). Resistance should be 1.2160. Eventual downside is the lower parallel of the channel that originates at the March 202o low. That line is about 1.1850.
June 3, 2021

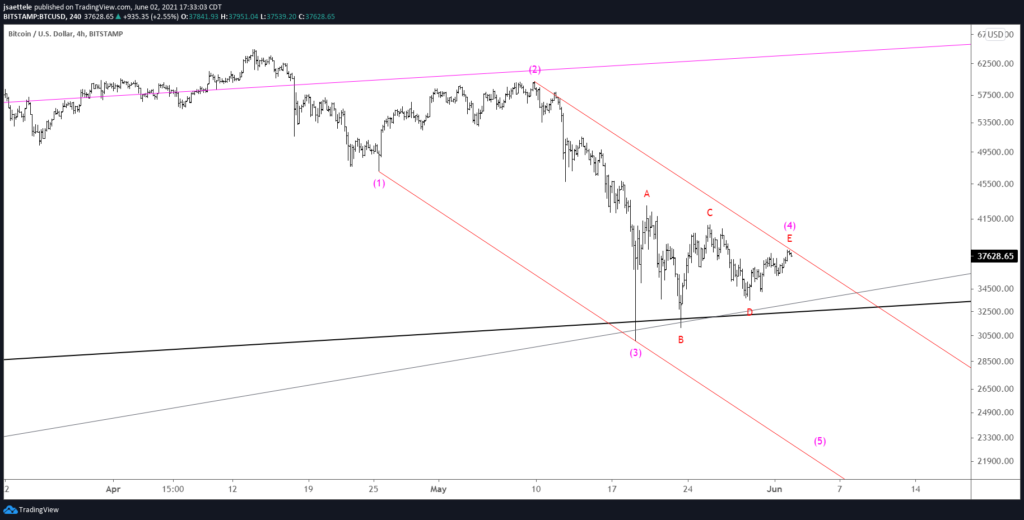
BTCUSD may have completed a 4th wave triangle within a 5 wave decline from the April high. The decline channels in perfect Elliott form and proposed wave 4 has traced out a well-defined triangle. If the proposed interpretation is correct, then BTCUSD is lower from the current level (this pattern negates above 40904).
5/19 – BTCUSD tagged the 32000 level (low was 30000) and snapped back but I don’t think this is the low. Notice where the snap back rally stalled…right at the underside of the former channel line (magenta channel). This is the ‘slingshot’ setup that I’m so fond of. If strength resumes then VWAP levels to know for resistance are 44400 (2021 VWAP) and VWAP from the top, which is currently 50000. The ultimate support is 19666, which is the 2017 high and the 25 line of the channel that we’ve been following. Recall that we turned bearish in February at the 75 line because the rally materialized at the 25 line. This is knows as median line symmetry (see daily chart below)!
May 20, 2021

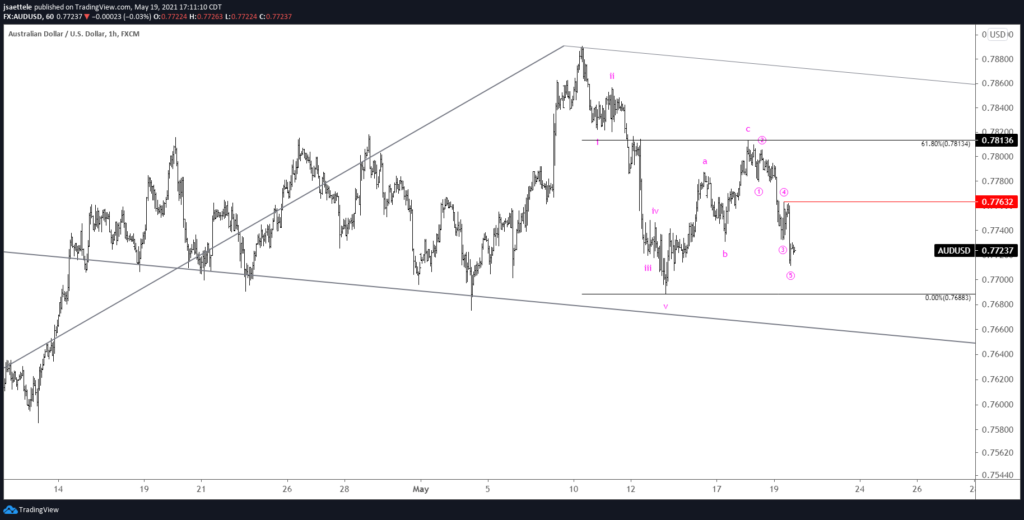
Since the 5/10 high, AUDUSD has dropped in 5 waves, rallied in 3 waves, and dropped in 5 waves at a lesser degree. An Elliott wave textbook! Resistance should be .7760/70 now. Broader downside focus is .7415 (2 legs down from the February high and the September high…see below). 5/18 – AUDUSD tagged .7814 today. Again, this is the 61.8% retrace of the decline from 5/10 and well-defined resistance since early January. This is a great spot for AUDUSD to roll over. .7730 needs to give in order to ‘open the floodgates’. This level is 2021 VWAP, VWAP from the February high, and VWAP from the March low (see futures chart below).
May 19, 2021

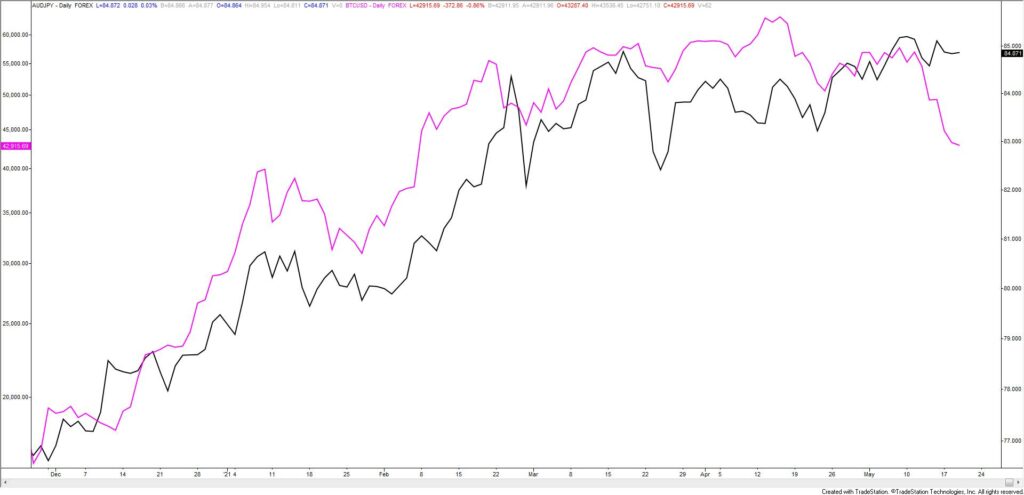
AUDJPY is in black and BTCUSD (bitcoin) is in magenta. My six year old son is standing behind me as a I type and just said ‘they look the same’. He’s right! We’ve been waiting for AUDJPY to tag the underside of the trendline from the 2008 low since February (AUDJPY is below). That line is currently about 86.50. I’d love a spike into that level to short but I’m not sure that happens with BTCUSD already breaking down. I’ll wait for 86.50 (or so) unless price breaks under the line that crosses lows since 4/23 (see magenta line on 4 hour chart below)
May 12, 2021

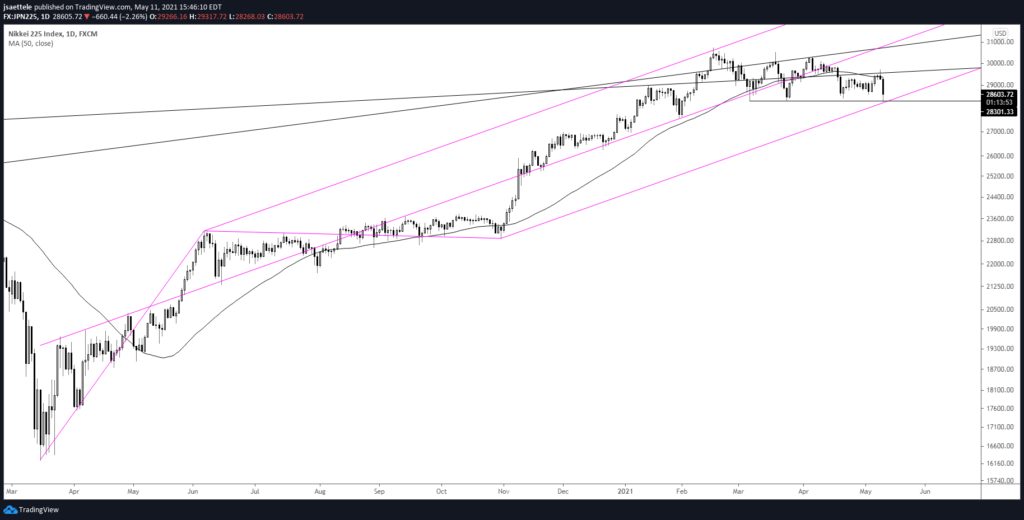
The Nikkei reached the lower parallel of the Schiff fork mentioned 3 weeks ago. The level is also support from March (3/5 and 3/24 lows). Huge level! A break below would complete a topping process that has been underway since 2/16 (descending triangle). Note that this possible topping pattern has taken place at the upper parallel of the channel from the 2009 low (see monthly chart below).
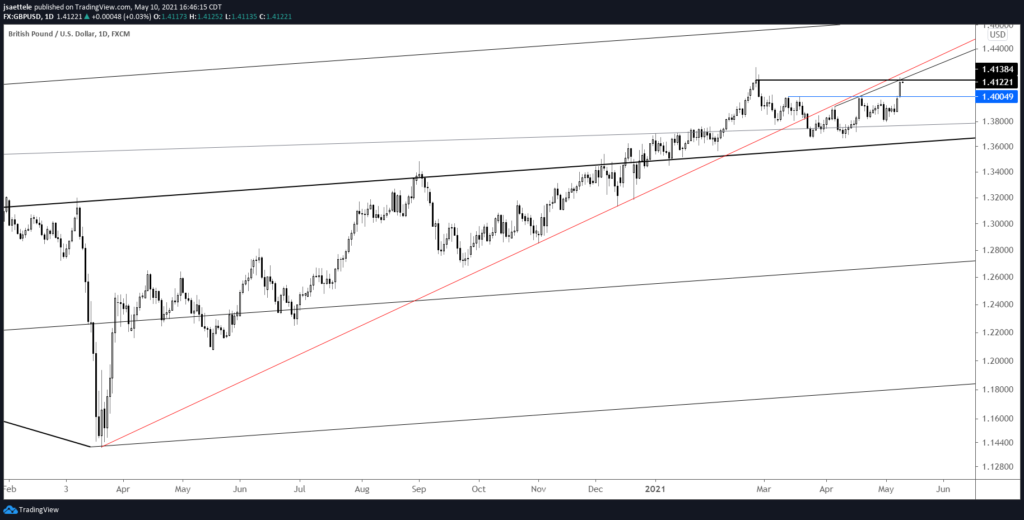
May 11, 2021

GBPUSD has soared over the last 2 trading days. Today’s break above the well-defined 1.4000 could propel price on its next leg up within the long term bull move but there is consideration for resistance at the current level. Daily reversal resistance is 1.4140 (2/24 close) and the underside of the trendline from the March 2020 low is slightly higher (red line). Let’s see what happens over the next few days.
April 23, 2021
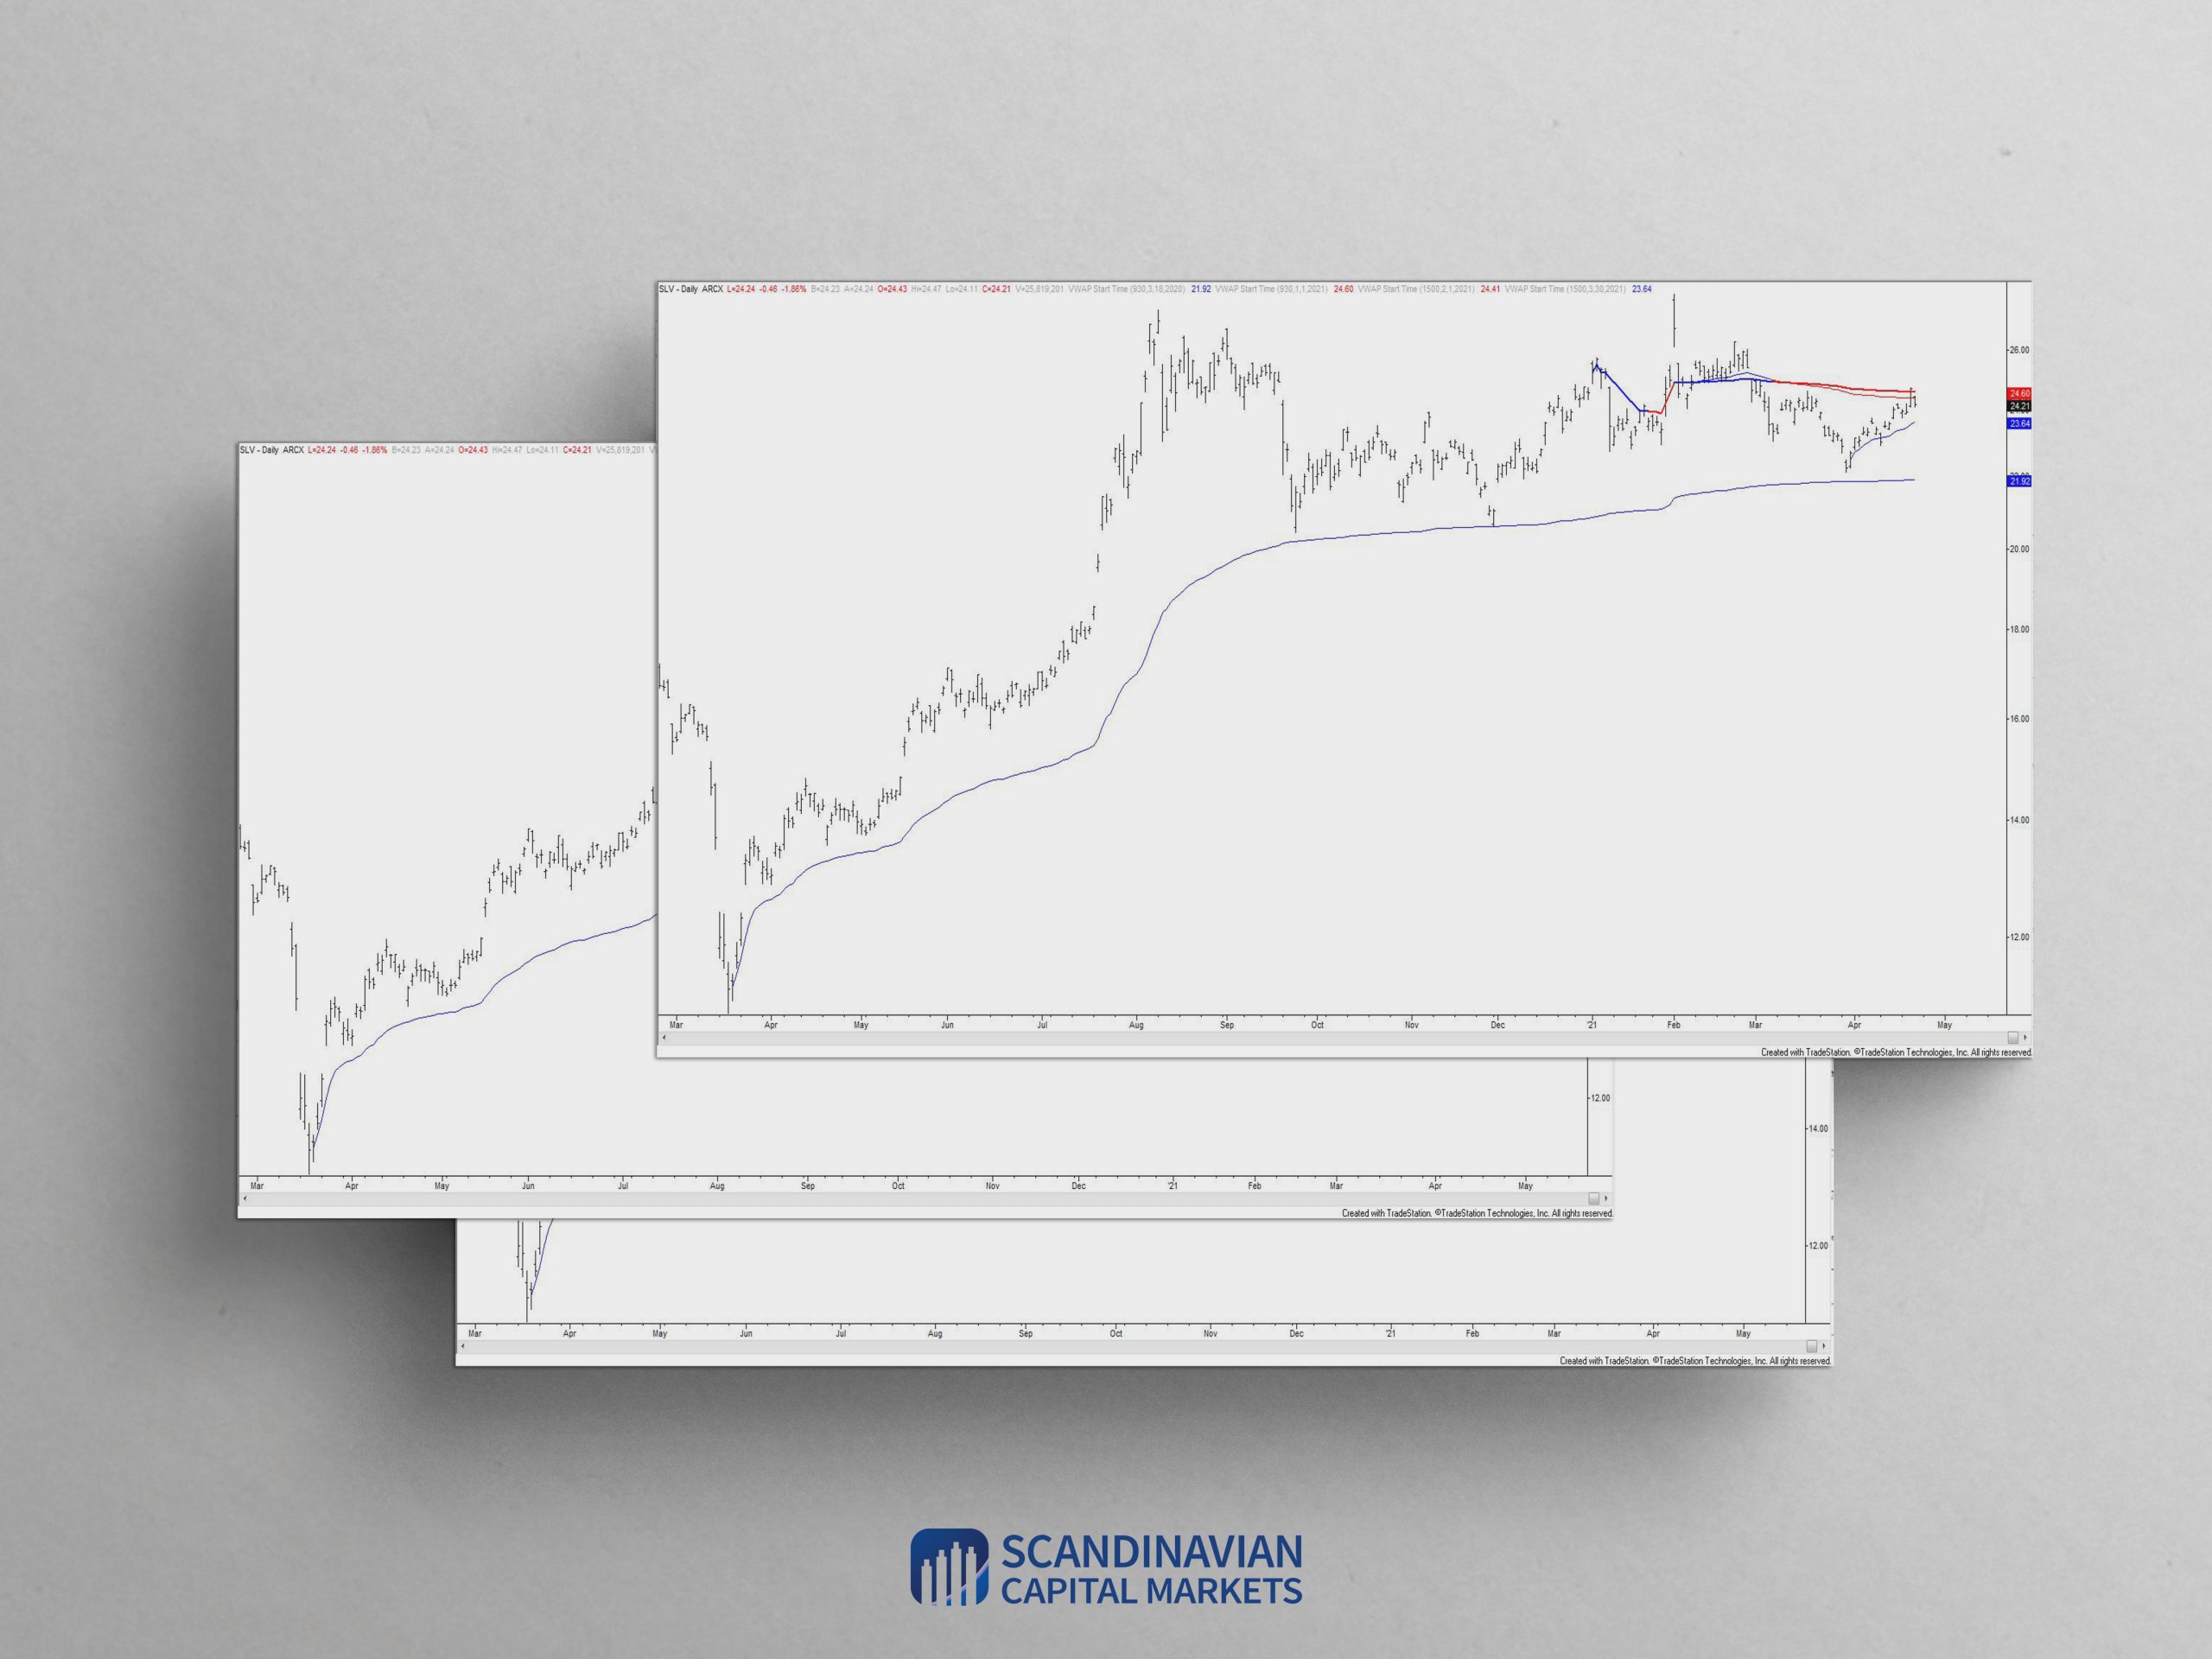
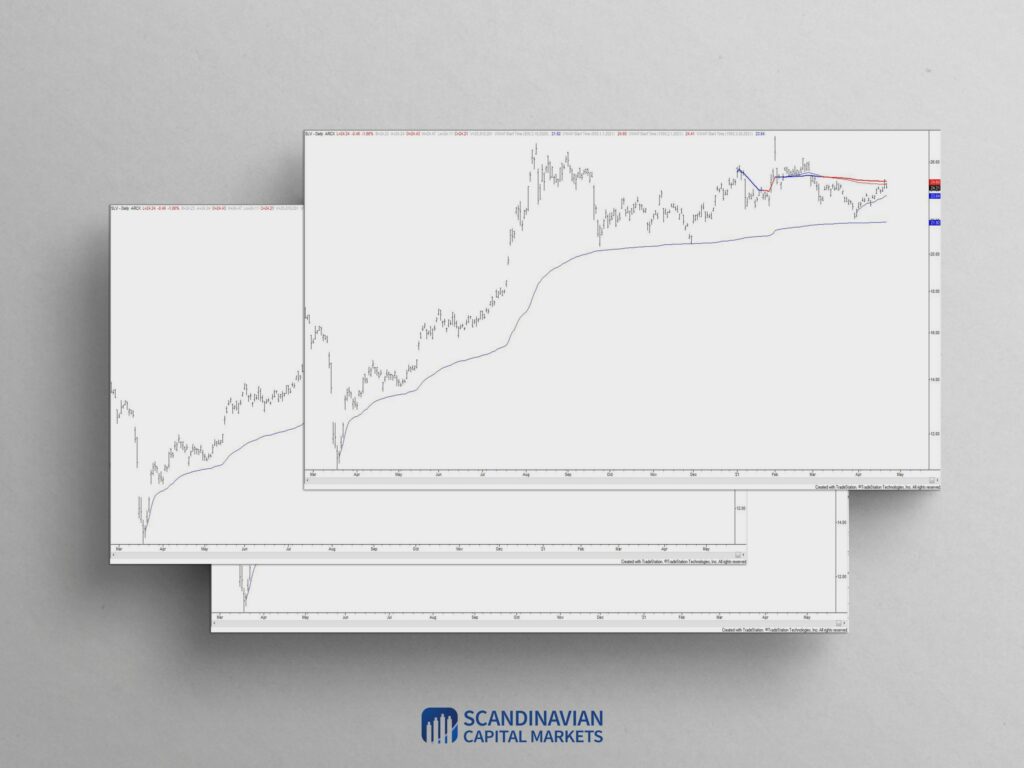
SLV has also run into 2021 VWAP. A pullback ‘makes sense’ with support near 23.60. The equivalent level for spot is 25.62. A big reason to hold a constructive longer term view on silver is the fact that VWAP from the March 2020 low has provided support on multiple occasions.