Education
June 22, 2021

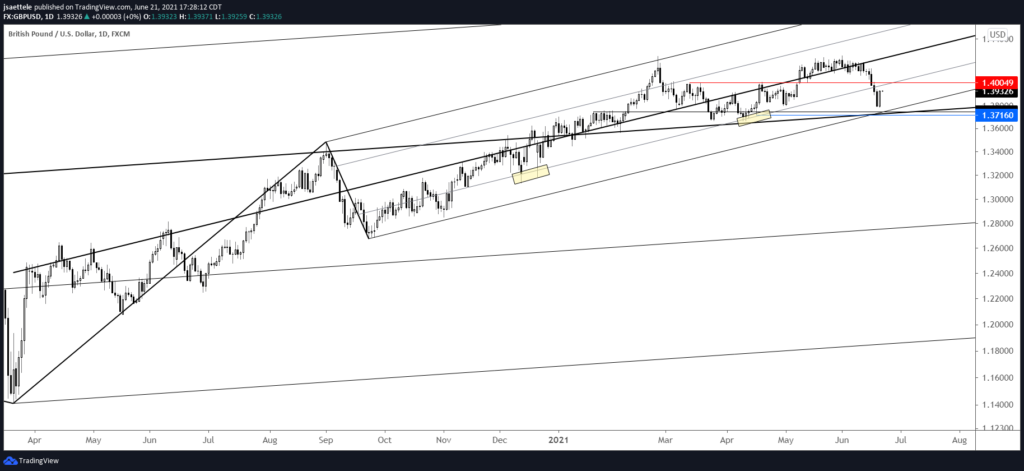
GBPUSD turned up prior to the proposed 1.3740 but 1.4000 remains in line for resistance. Besides being ‘clean’ horizontal resistance, the level is also defined by the 25 line of the Schiff fork from the March 2020 low. This line was support in December and April…so watch for support to turn into resistance.
June 17, 2021

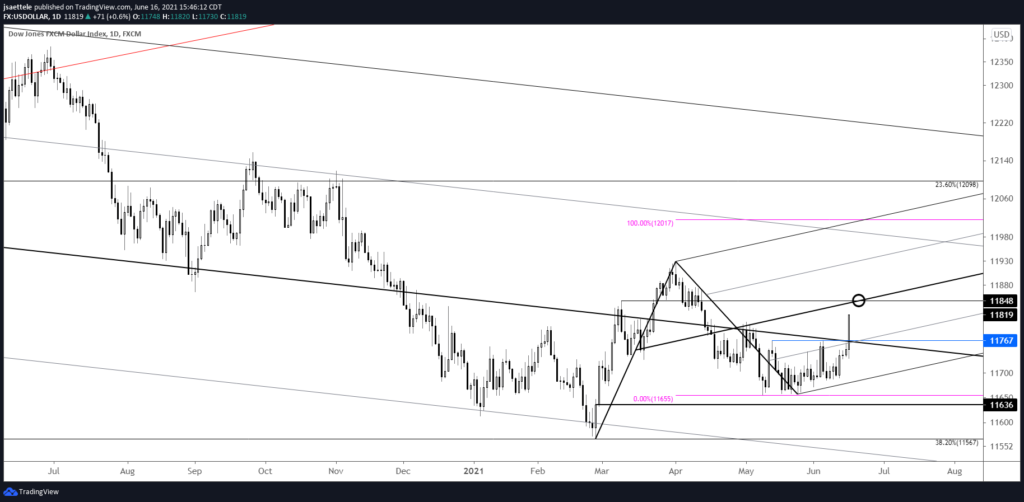
Today’s move in USDOLLAR proves us correct in the assertion that action since the beginning of the year is a bullish base. The top side of the median line is now support near 11767. A pullback is possible from the center line of the channel from the yearly low. That line is near 11848. Strategically, either wait for a pullback to 11767 or a break above 11848 (median line) and then look to buy a pullback into 11848 (or so).
June 16, 2021

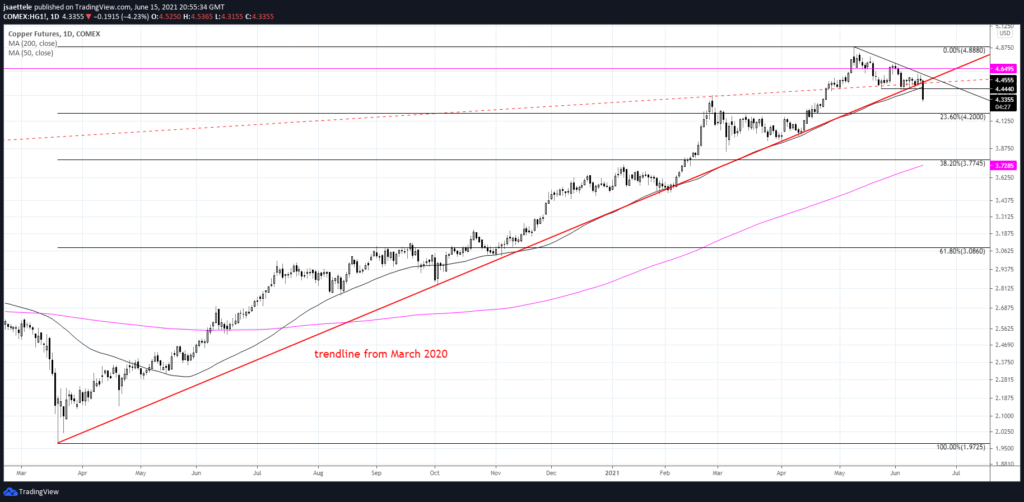
Copper broke today and the first level of interest on the downside is the 23.6% retrace of the rally from March 2020 at 4.20. This level coincides with resistance from this March. Former support at 4.4440 (also the 50 day average) is now proposed resistance.
June 10, 2021
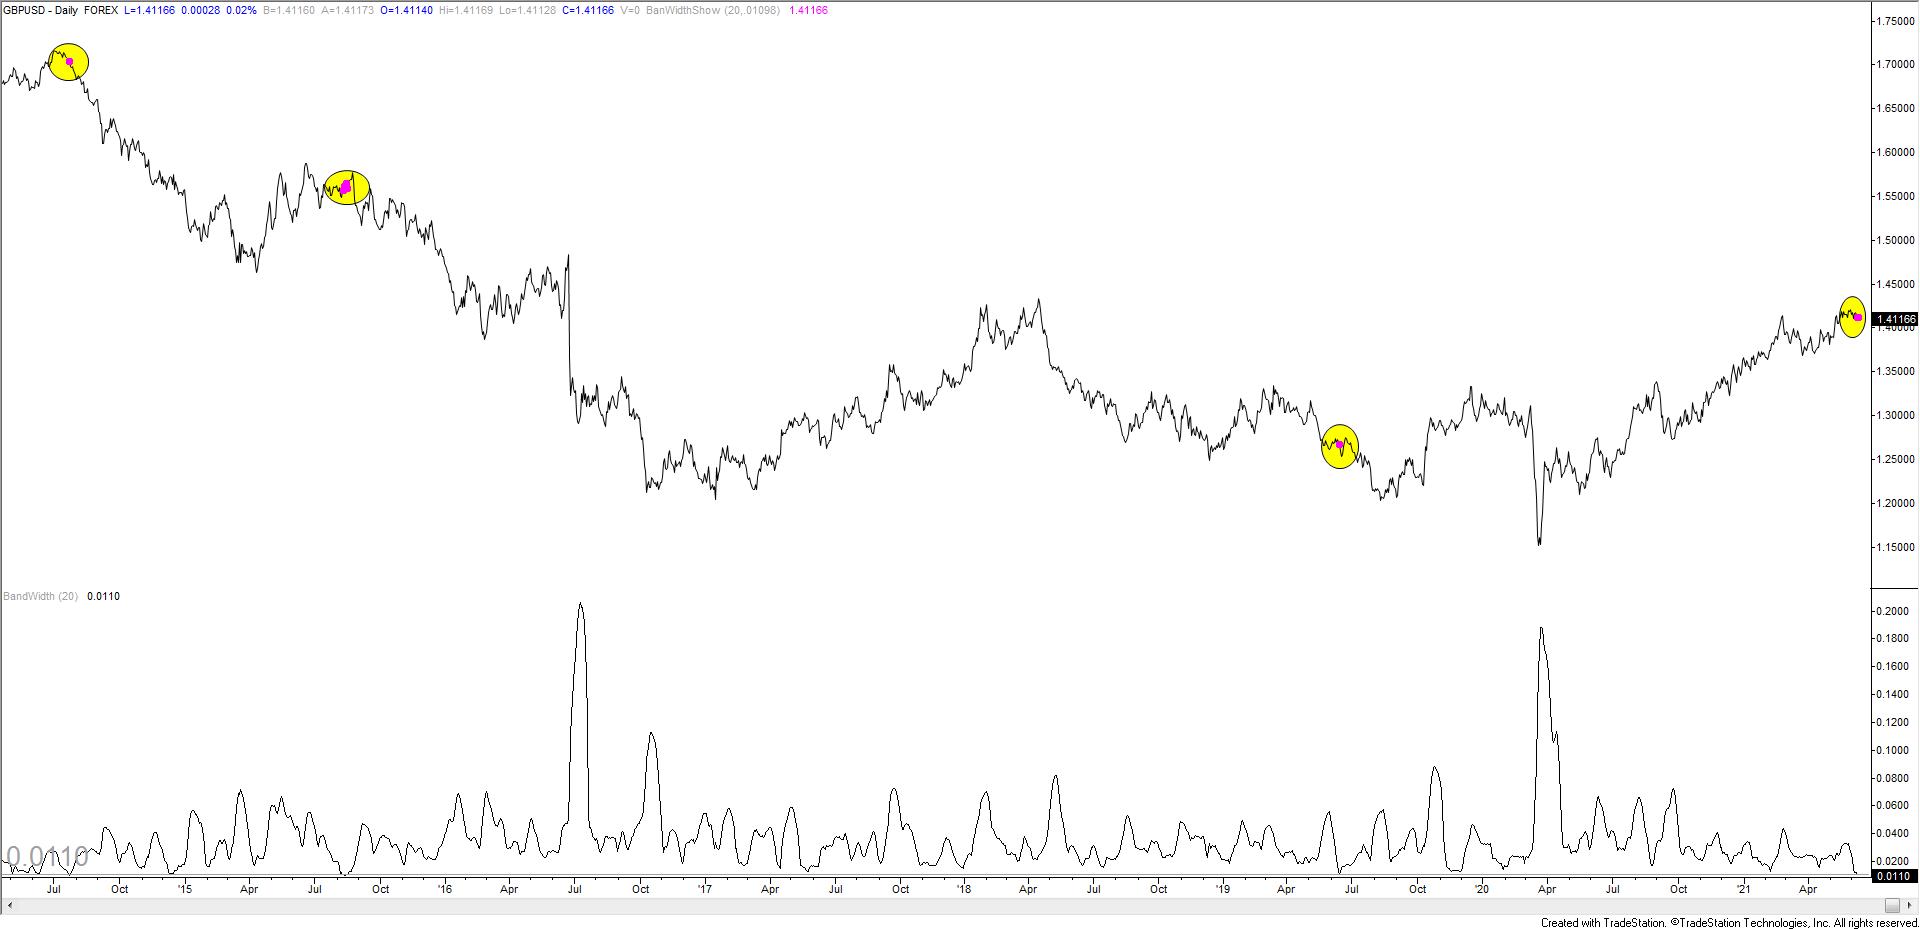
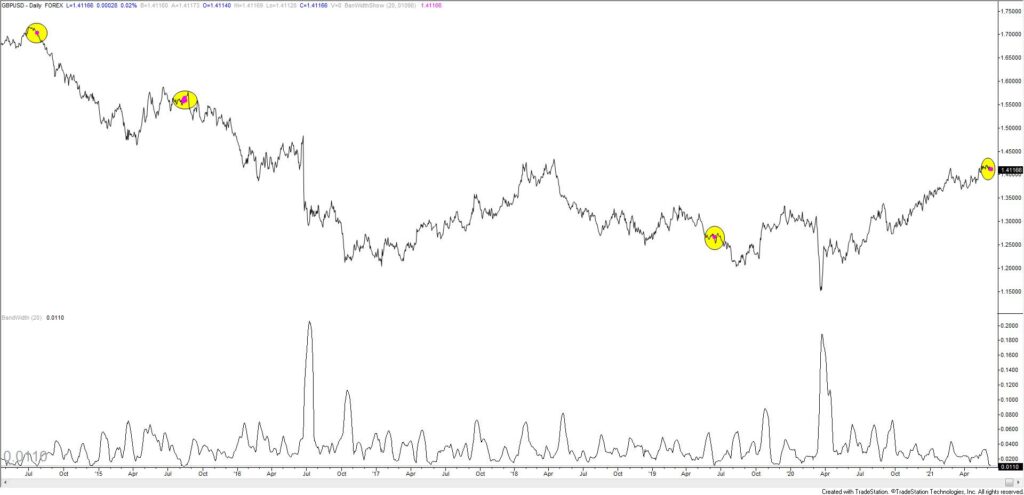
Daily Bollinger Band width for GBPUSD is extremely low. The reading is towards the lower end of its historical range. Readings this low are shown with magenta dots. Although BB width is not a directional indicator, extremely low readings have occurred before sharp declines. This makes sense since extreme complacency (as indicated by narrow Bollinger Bands) occurs at USD lows.
May 19, 2021

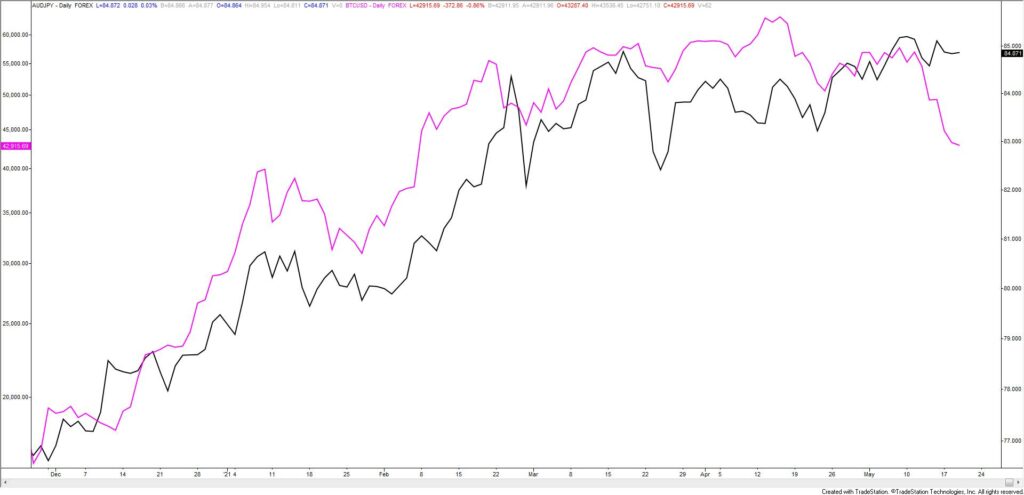
AUDJPY is in black and BTCUSD (bitcoin) is in magenta. My six year old son is standing behind me as a I type and just said ‘they look the same’. He’s right! We’ve been waiting for AUDJPY to tag the underside of the trendline from the 2008 low since February (AUDJPY is below). That line is currently about 86.50. I’d love a spike into that level to short but I’m not sure that happens with BTCUSD already breaking down. I’ll wait for 86.50 (or so) unless price breaks under the line that crosses lows since 4/23 (see magenta line on 4 hour chart below)
April 22, 2021
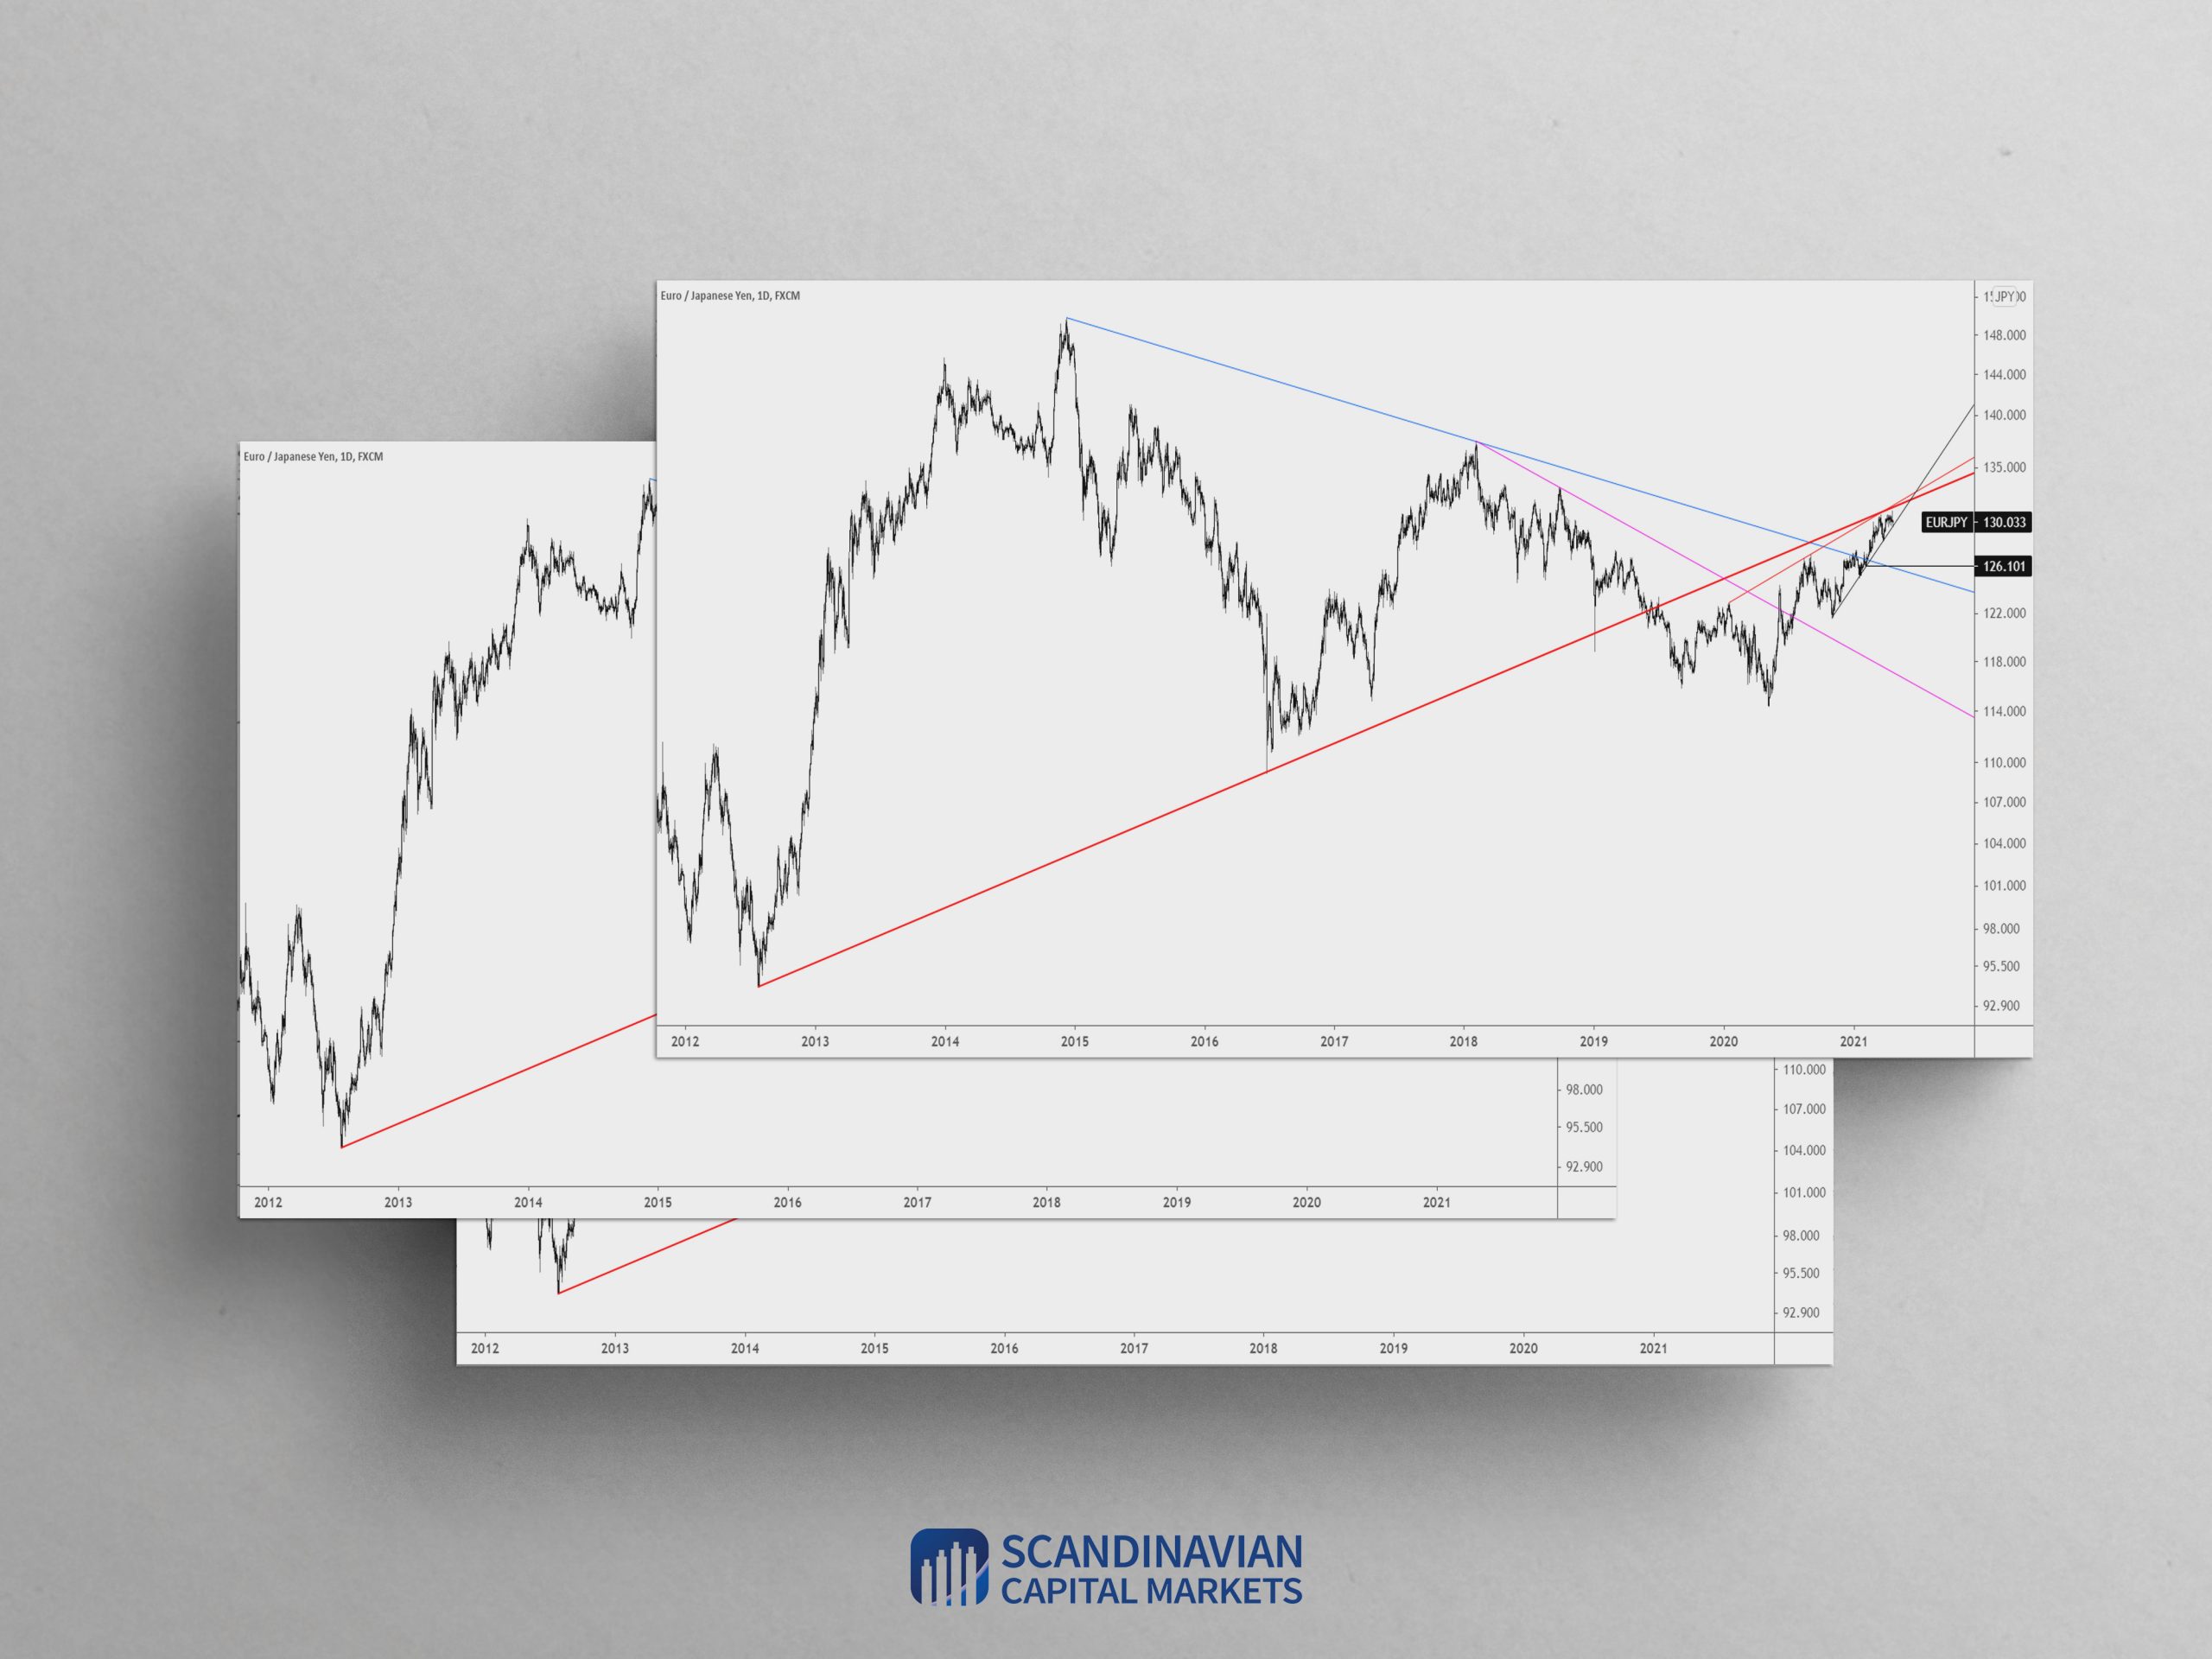
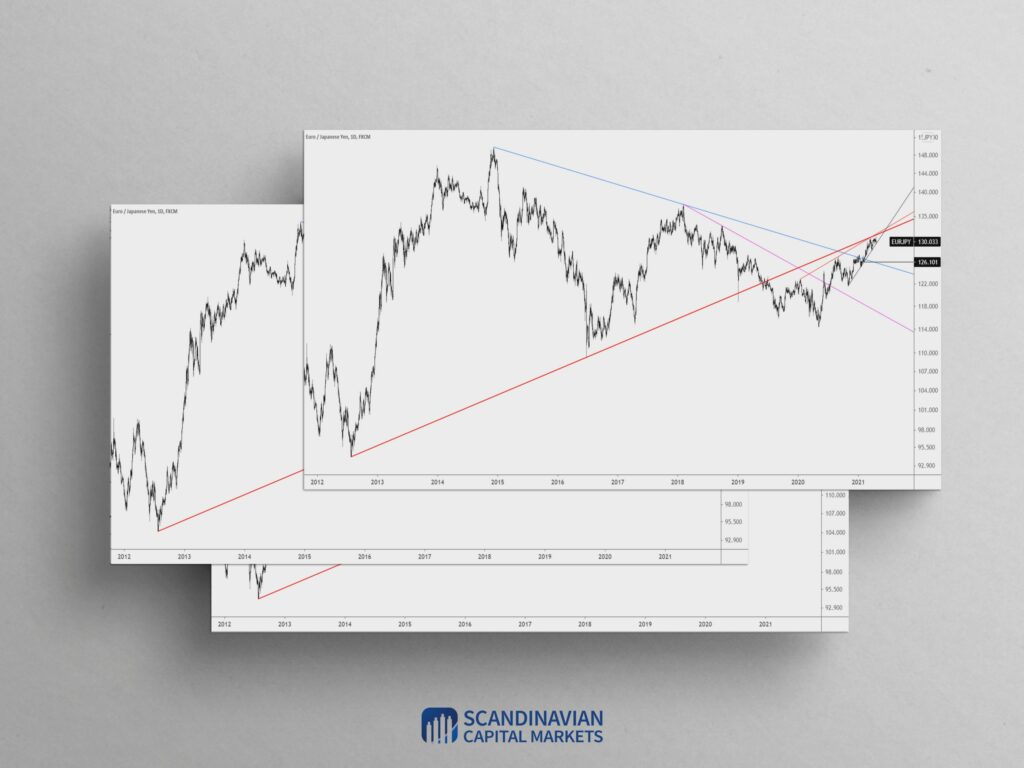
I’ve been tracking EURJPY for a top as it approached the underside of the trendline from the 2012 low since February. On Tuesday, price spiked higher and reversed yet just missed the trendline. I ‘want’ to short. A break of the trendline from the November low is needed in order to trigger.
March 25, 2021
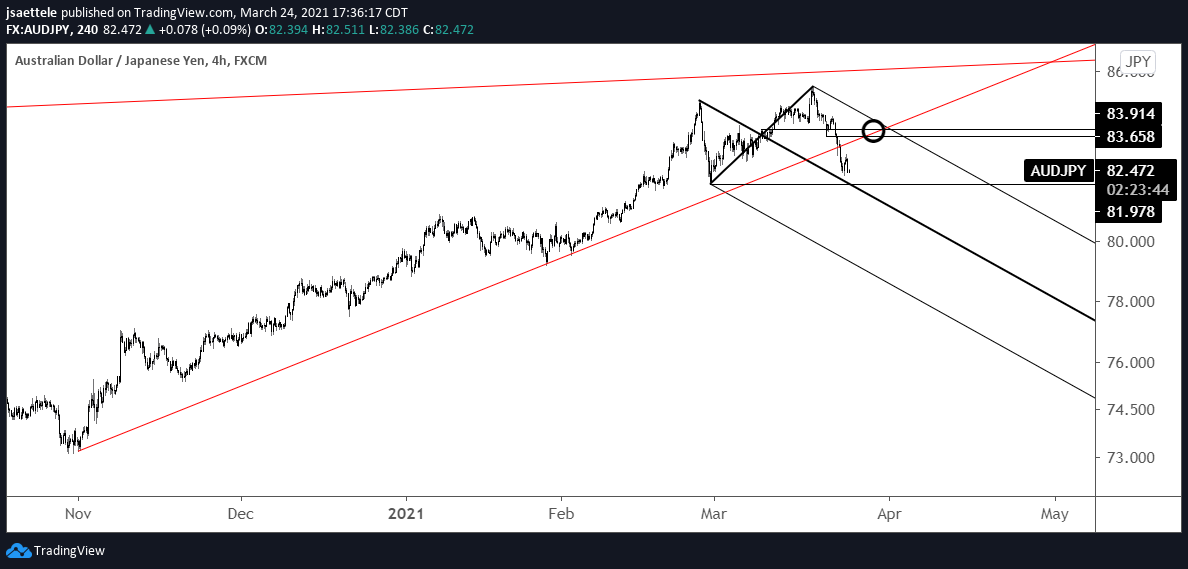
I love this AUDJPY short setup. Price has broken below the trendline from the November low. The underside of that line is now proposed resistance at 83.65/90. The 2/26 low is a bounce level at 81.98. Downside is the lower parallel from the bearish fork, which is significant (probably a 78 handle).
February 25, 2021
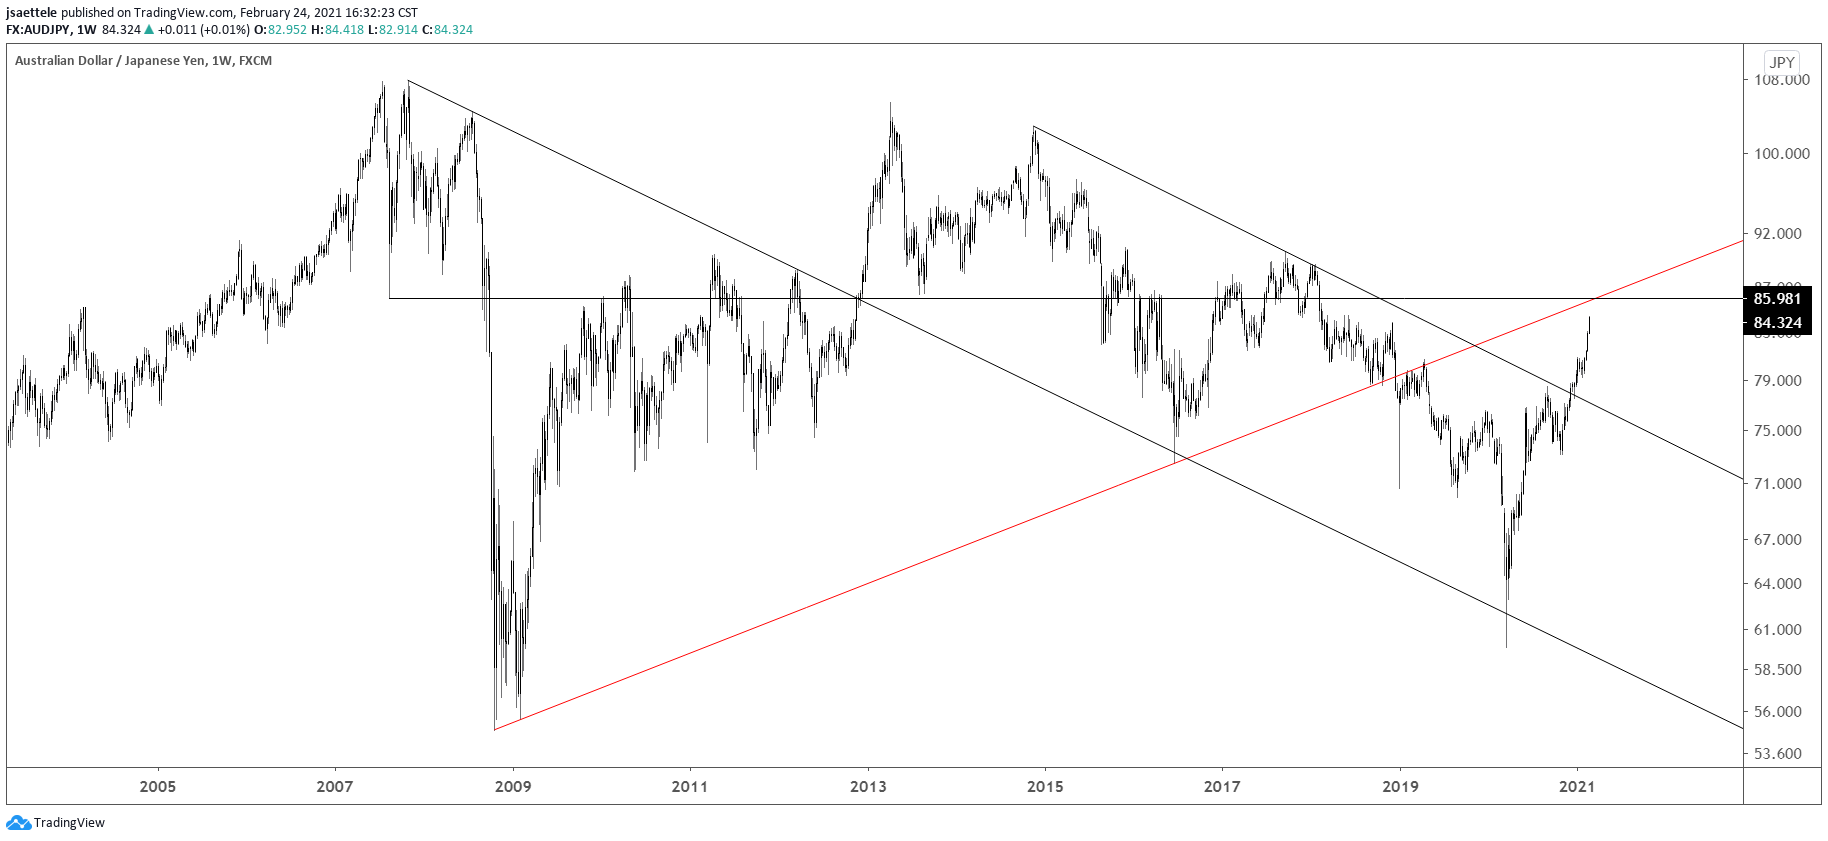
AUDJPY is nearing the line off of the 2008 and 2016 lows. This line was support in October 2018 and resistance in early 2019 so watch for resistance there again. The line is about 85.80. Daily RSI is 83.6 (see the next 2 charts), which has only been reached once before, in December 2005. Price topped then and fell over 6 big figures in the next 2 weeks.
November 19, 2020

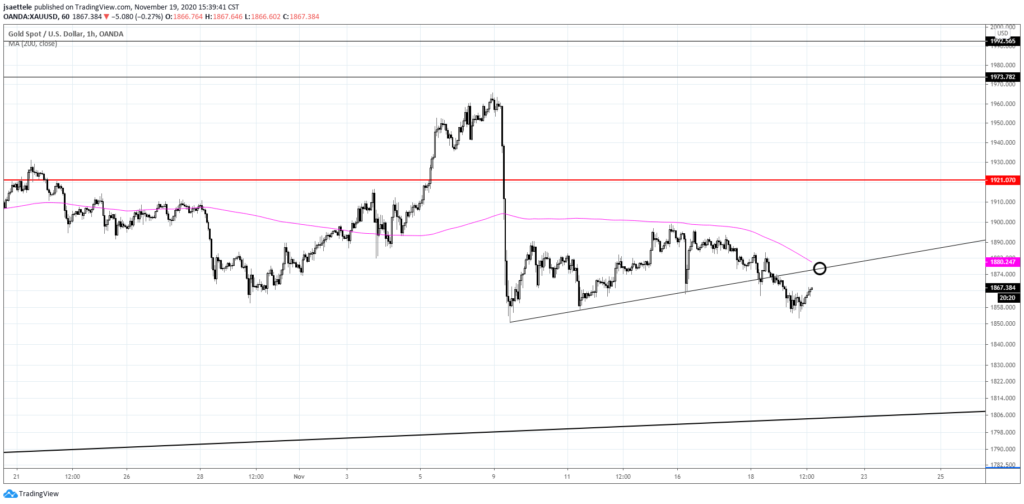
Assets prices were down in early U.S. trading as the USD rallied but everything reversed course when the magical U.S. session got underway (stocks up, metals up, USD down, etc.). I still like gold lower but a bit more strength may be in order to test resistance near 1876.