Education
December 16, 2021

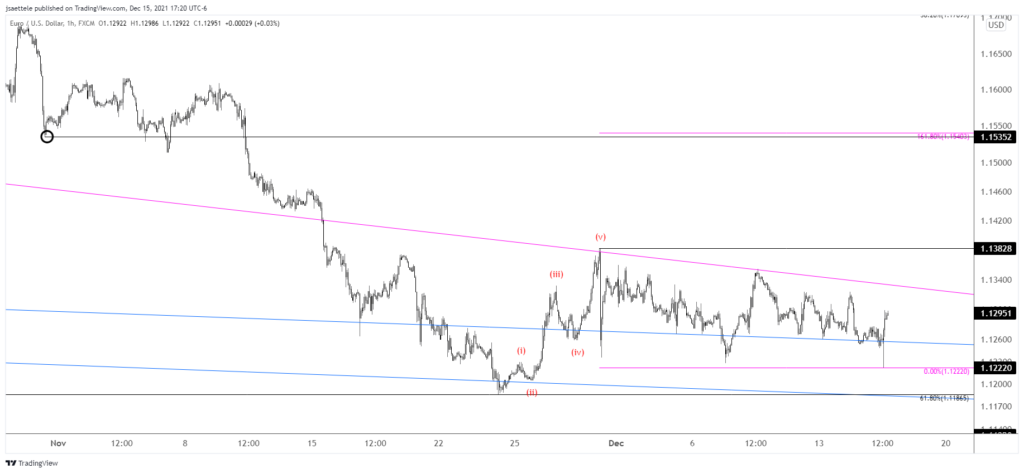
Is the nightmare correction over for EURUSD? The ‘look’ is definitely there. For Elliott nerds, everything from the 11/30 high constitutes a complex correction labeled W-X-Y. This means that the drop is in 3 waves but the corrective legs of the structure are also corrective in nature. Upside focus is the 161.8% retrace at 1.1540, which is also the 10/29 low. Proposed support is the high volume level from today at 1.1273 and 61.8% of today’s range at 1.1252. ECB is tomorrow.
December 14, 2021

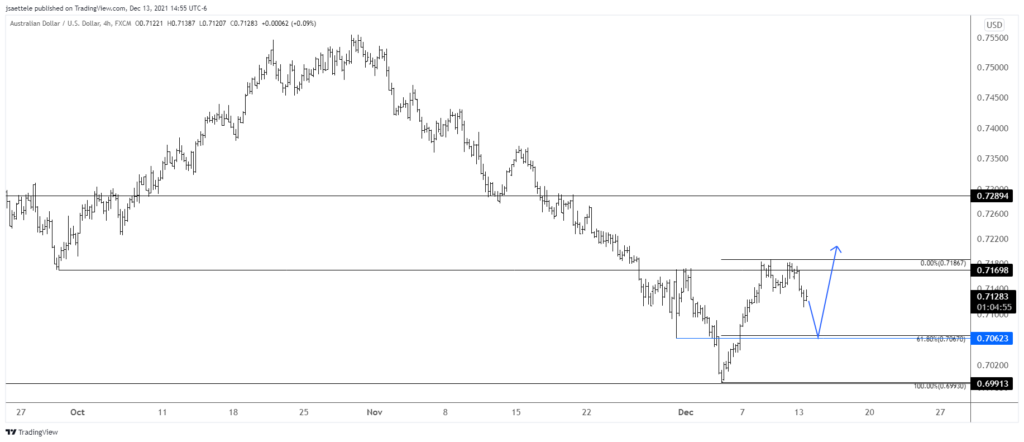
AUDUSD has pulled back following a slight push above .7170. My view is that the decline is corrective. The 61.8% retrace is in line with the 11/30 low at .7060s. That sticks out to me as the ideal spot for support.
December 10, 2021

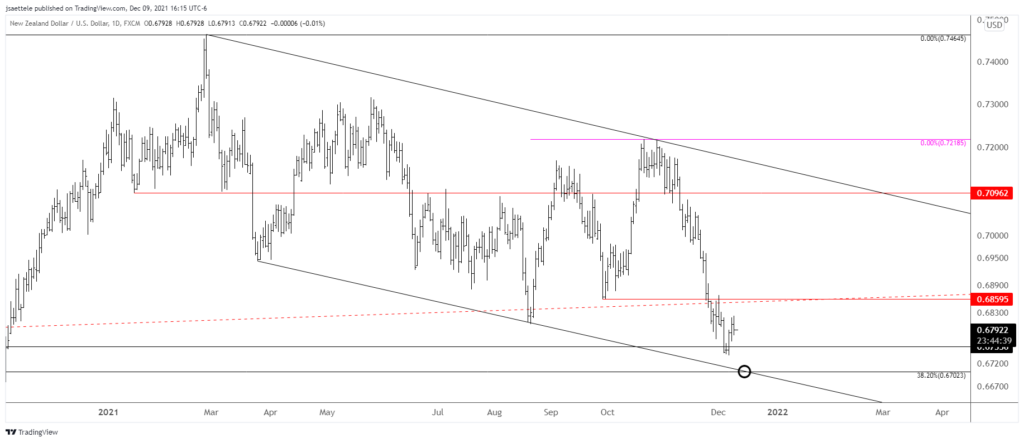
NZDUSD has lagged AUDUSD on this bounce, which is interesting because AUDUSD reached it’s key level (.6990) but the key level for NZDUSD is slightly lower at .6700. Recall that this is the 38.2% retrace of the rally from March 2020 and the line off of lows since March. The November 2020 low has been reached at .6756 but I love the confluence at .6700. Watch for a possible non-confirmation with AUDUSD and NZDUSD. This would occur if NZDUSD drops to a new low but AUDUSD makes a higher low. This non-confirmation tends to occur at turns. .6860 remains an important overhead barrier.
December 2, 2021

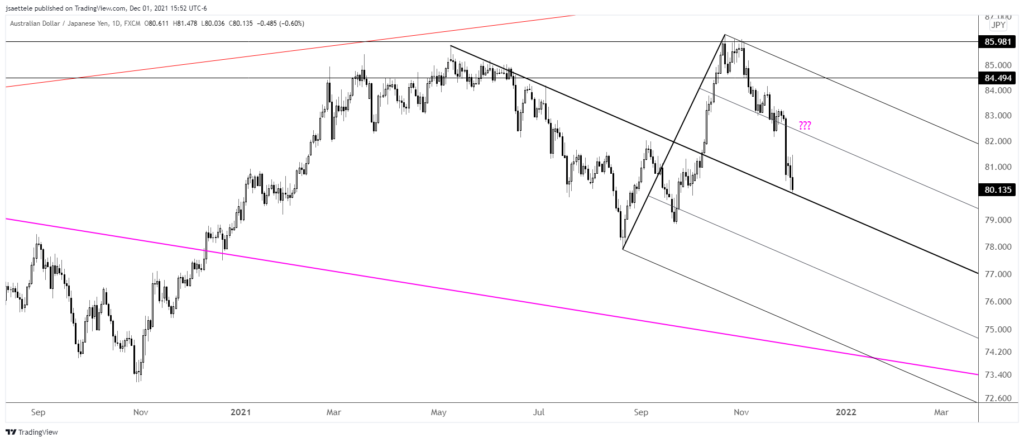
AUDJPY is the ultimate risk barometer. As usual, it’s WAY ahead of the equity market (the equity market is always the last to know). Price has reached the median line of the fork that originates at the May high. This is a good spot for a bounce and 82.40 is well-defined for resistance. This is the 25 line, which was support on 11/10. Ultimately, a downside objective is near 74 (see below).
November 23, 2021

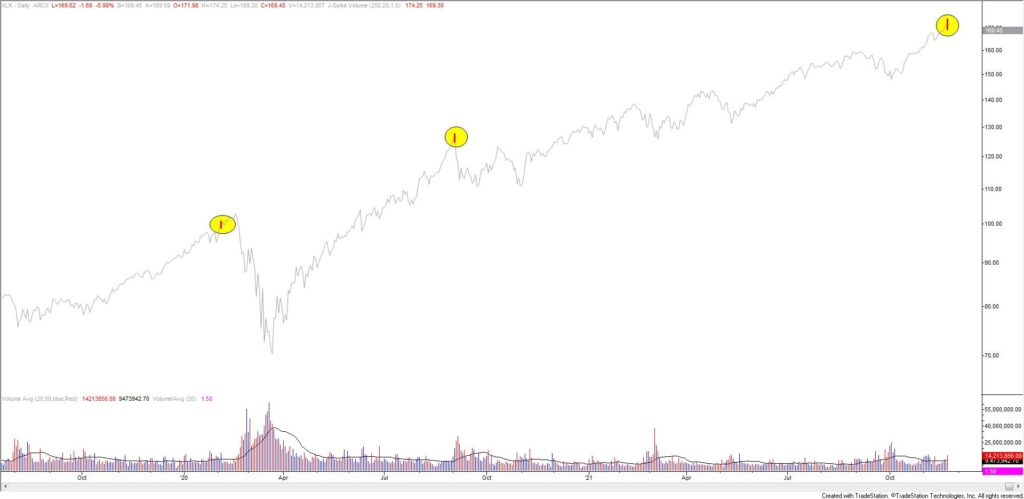
Is this the ‘Powell top’? XLK (tech ETF) made a daily volume reversal today and Nasdaq futures (see below) topped a few ticks under channel resistance. This channel was resistance for the September top. From a very big picture perspective, I’ll note that the market cap of the 5 largest companies as a percentage of the S&P 500 is extreme (see 2 charts down). The 5 largest companies are all tech companies by the way. In other words, it’s a highly concentrated market. Historically, this is unsustainable.
November 18, 2021

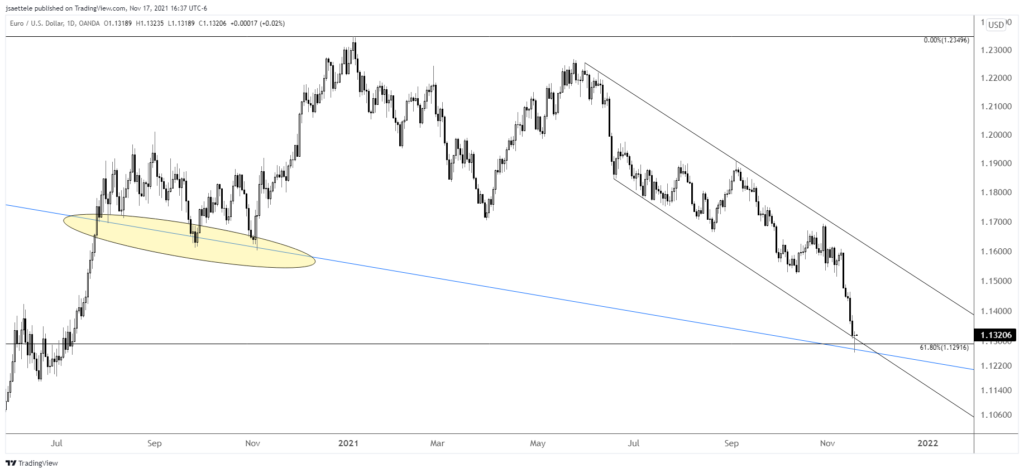
EURUSD low today was 1.1263. How about that trendline! I can’t think of a better technical combination, a Fibonacci level and long term well-defined trendline, to mark an important turning point. I am bullish against the low. The first hurdle on the upside is the weekly opening price at 1.1446 followed by former support at 1.1525. Support should be 1.1290-1.1300.
November 15, 2021
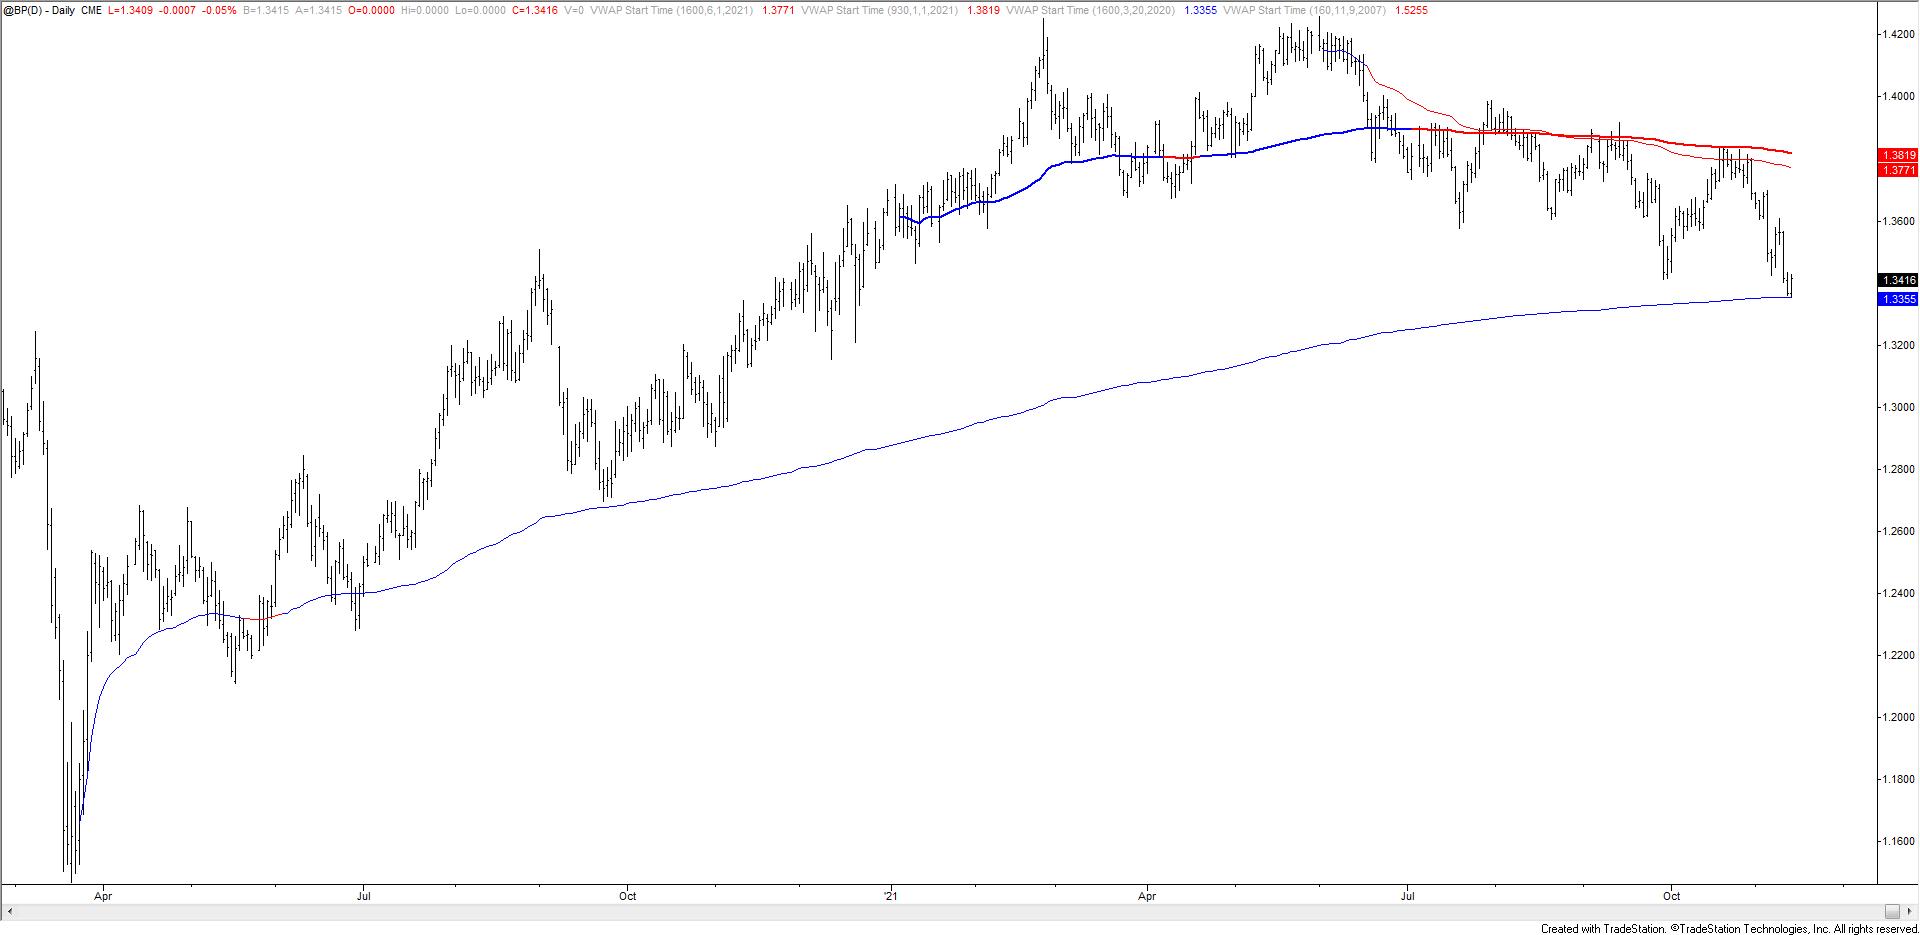
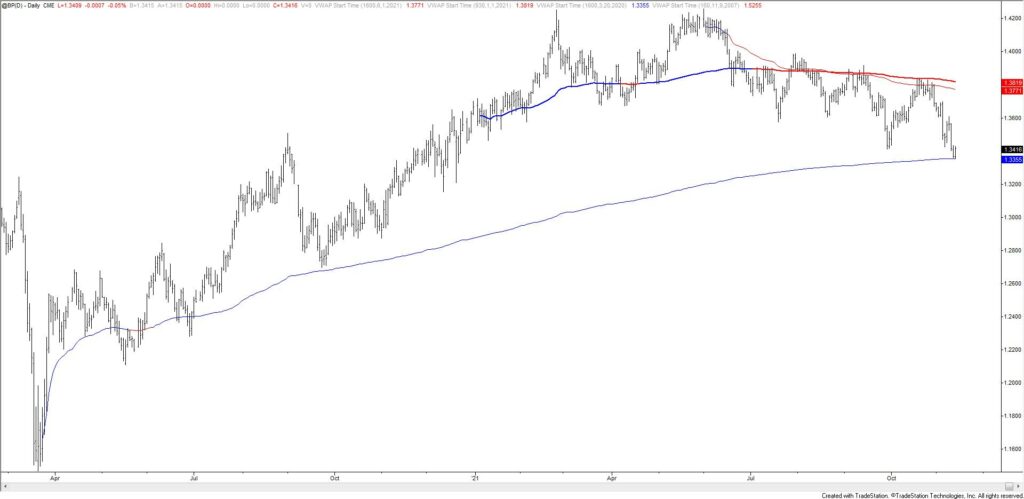
GBPUSD held VWAP from the March 2020 low on Friday. As noted last week, lower parallel support is slightly lower near 1.3320 (see below) though. If the rally from last week’s low extends into a small 5 wave advance then I’ll want to but a small dip.
November 11, 2021
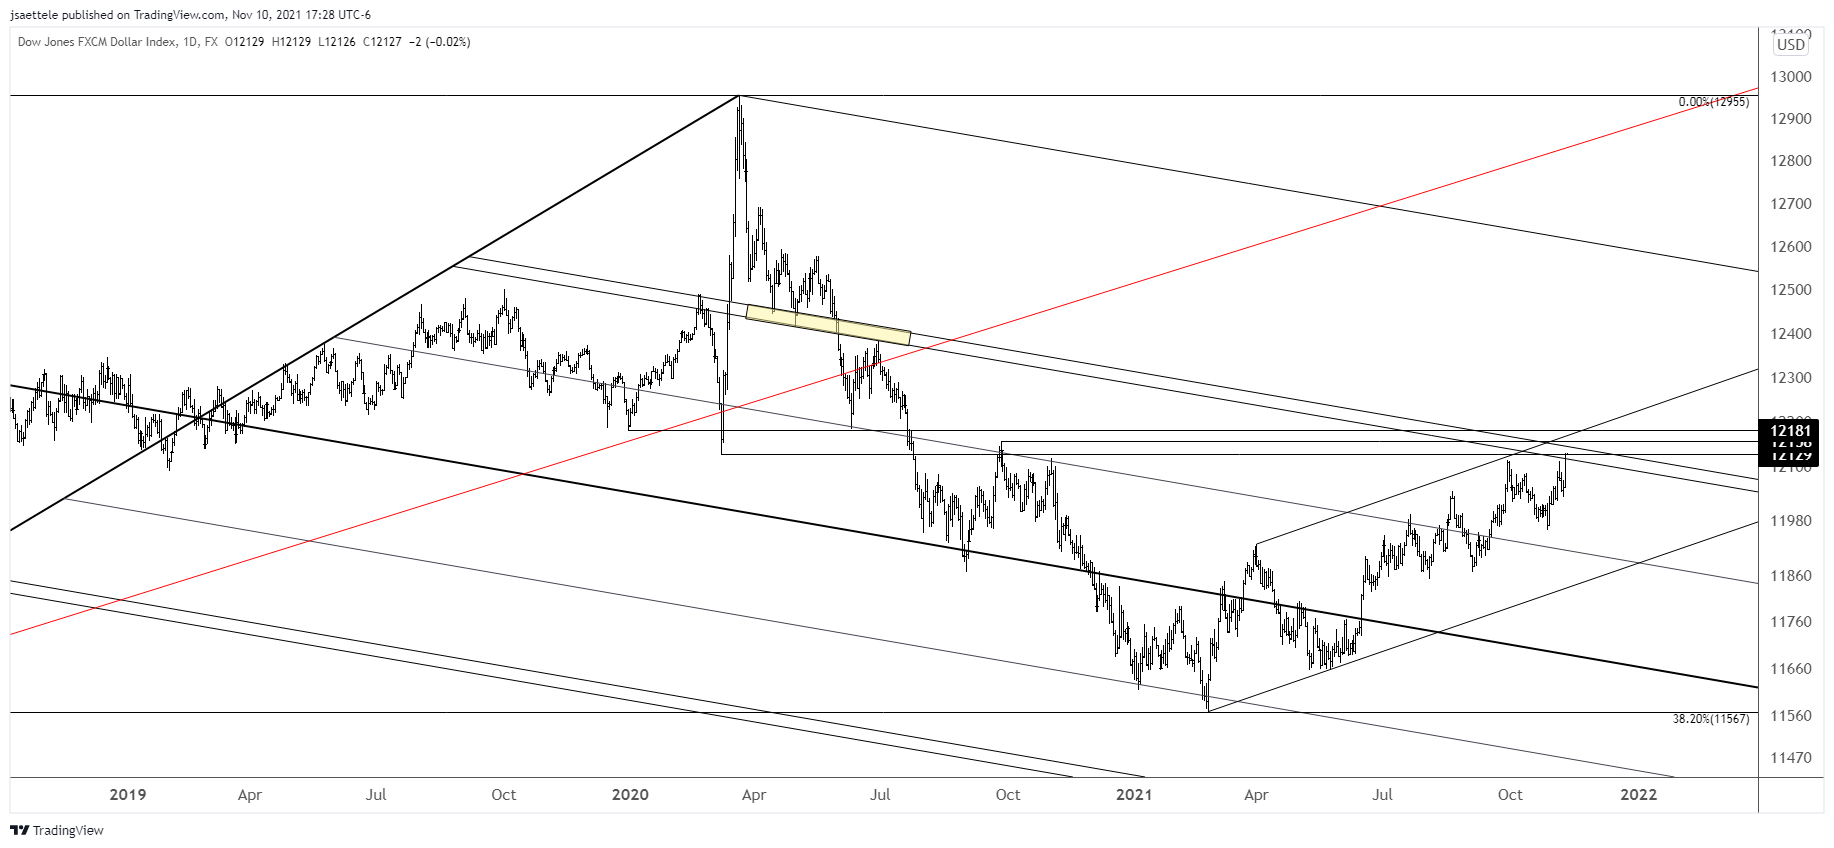
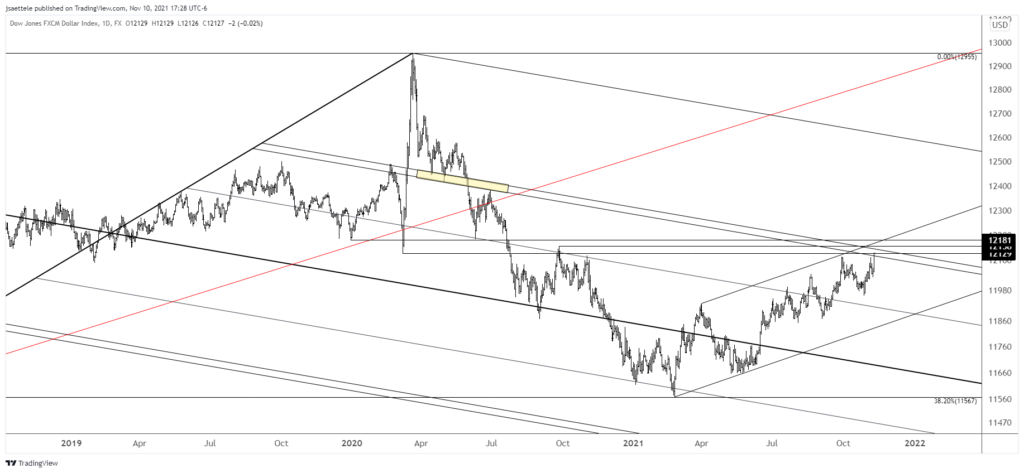
So much for all of that fancy Elliott mumbo jumbo. Remember the ‘5 waves down at multiple degree…blah blah blah’. USDOLLAR (quarter each of EUR, GBP, JPY, AUD) ripped to its highest level since September 2020 today. Sometimes various methods work and sometimes they don’t. The methods that I employ haven’t worked well for a few months now. This will change. It always does. Anyway, USDOLLAR is still in the vicinity of longer term resistance. The zone extends to 12181, which is the December 2019 low and parallel resistance.
November 4, 2021

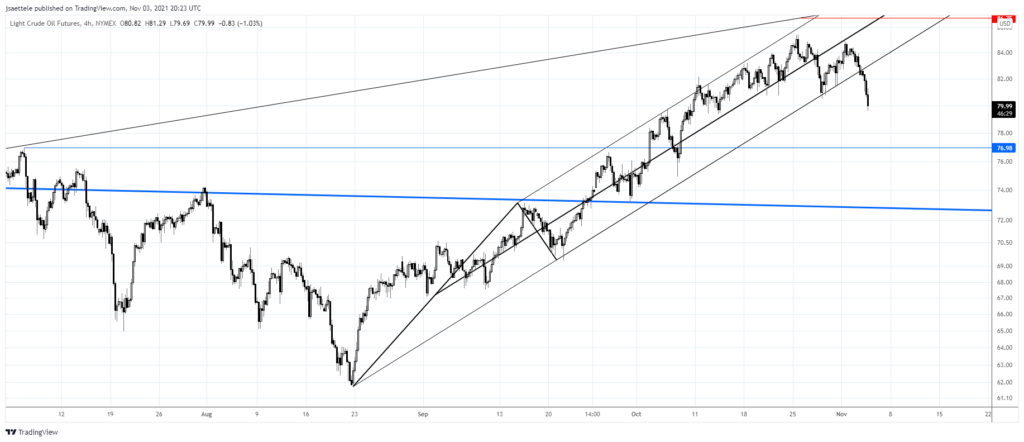
Crude traded up to 84 (a bit above) and has gone straight down since. 82.20 is now proposed resistance if crude bounces. Downside focus is the July high at 76.98 and possibly the top side of the LONG TERM former resistance line (now support) near 73. The weekly chart below shows the this long term chart in its entirety.