
Market Update 11/17 – USD Reversal?
EURUSD DAILY
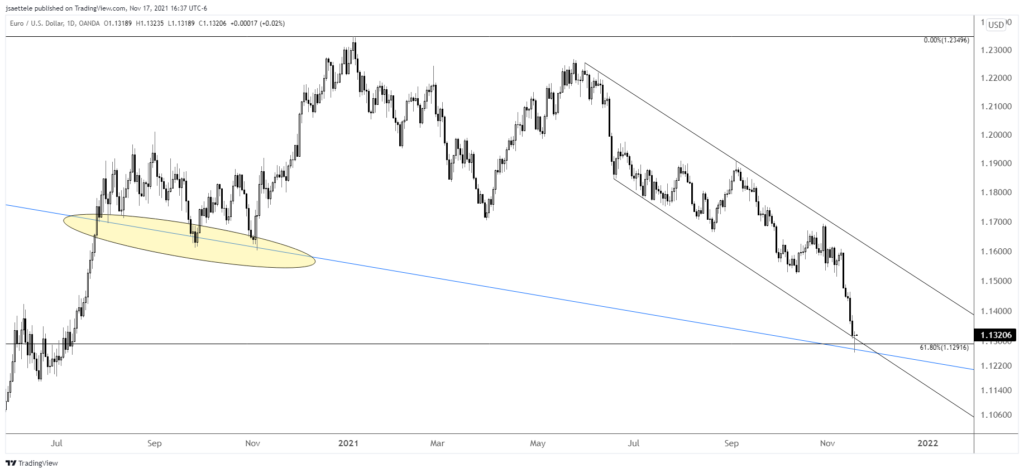
EURUSD low today was 1.1263. How about that trendline! I can’t think of a better technical combination, a Fibonacci level and long term well-defined trendline, to mark an important turning point. I am bullish against the low. The first hurdle on the upside is the weekly opening price at 1.1446 followed by former support at 1.1525. Support should be 1.1290-1.1300.
11/16 – Pay attention to the 61.8% retrace of the rally from March 2020 at 1.1291. Also, the top side of the 2009-2018 line (blue line) is about 1.1265. This line was support in September and November 2020 (election day 2020 support). Bottom line, 1.1265/91 is key.
USDJPY DAILY
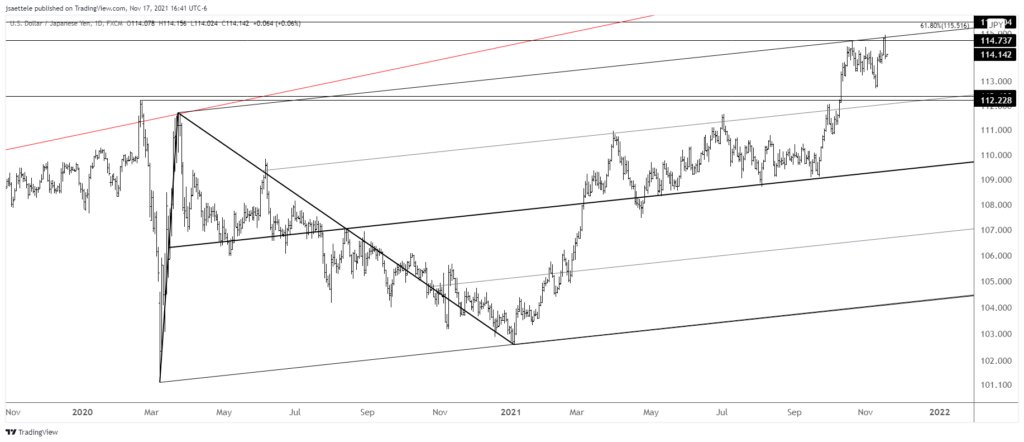
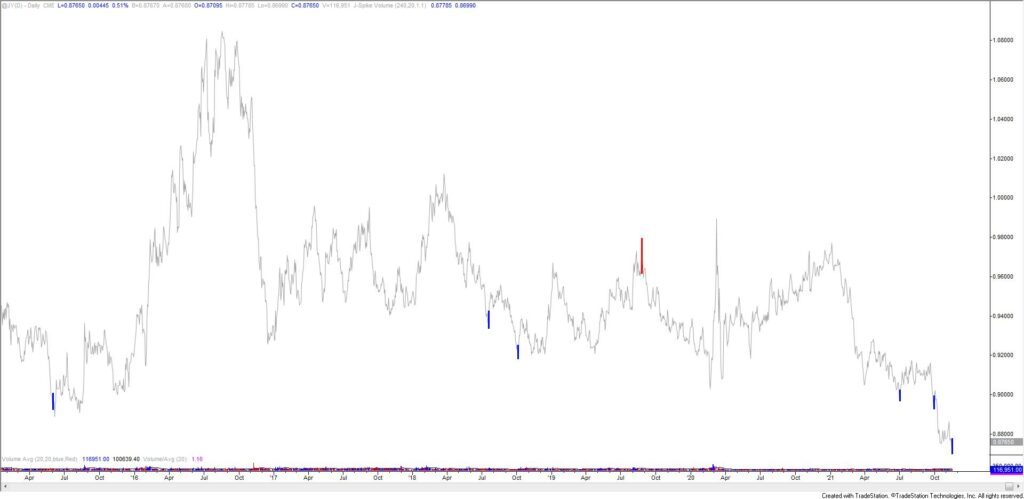
USDJPY put in a bearish outside day today after trading to its highest level since March 2017. Resistance also registered from channel resistance. RSI divergence attends the high as well (not shown). Futures registered a high volume reversal (see below). It all adds up to a bigger USDJPY reversal setup. Broad focus is towards 112.20/40. Watch for resistance near 114.40/50.
JAPANESE YEN FUTURES DAILY
GBPUSD 4 HOUR
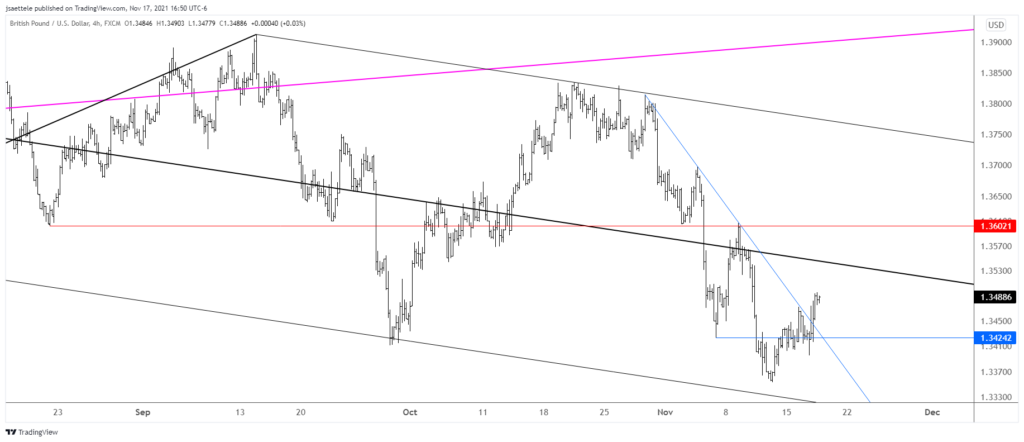
GBPUSD has followed through on its bullish reversal from the noted VWAP level. I don’t have a handle on the pattern (maybe an ending diagonal from the August high?) but near term trading levels are clear. 1.3420s should be support and 1.3600 is proposed resistance.
11/14 – GBPUSD held VWAP from the March 2020 low on Friday. As noted last week, lower parallel support is slightly lower near 1.3320 (see below) though. If the rally from last week’s low extends into a small 5 wave advance then I’ll want to but a small dip.
NZDUSD DAILY
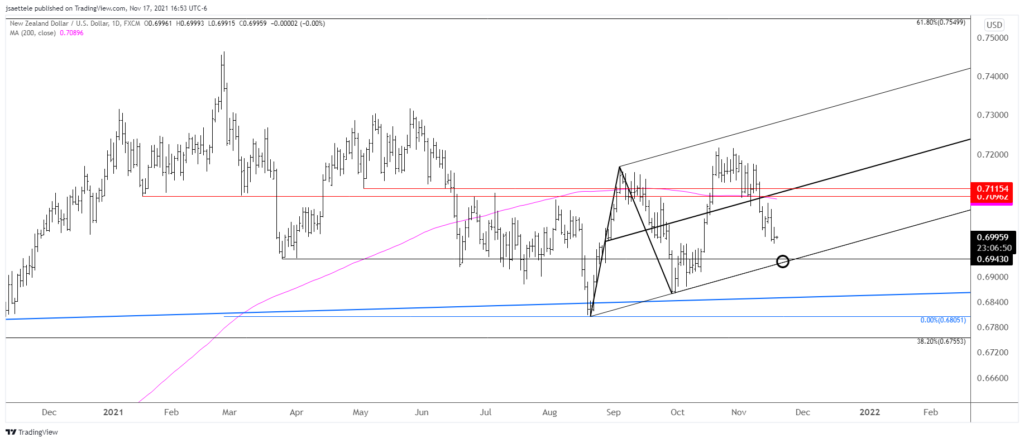
Kiwi continues to slide so focus is squarely on the lower parallel near the March low of .6943. Given the broader USD reversal ‘look’, I’ll be interested in the long side of price reacts near that level. The .7100 figure looms as an important test on the upside.
11/14 – NZDUSD didn’t hold .7050 but there are well defined levels to pay attention to for near term support/resistance. The underside of the center line of the channel from the August low is near .7100. The 200 day average reinforces the level as possible resistance. Proposed support is the lower parallel and March low at .6943.
USDCAD DAILY
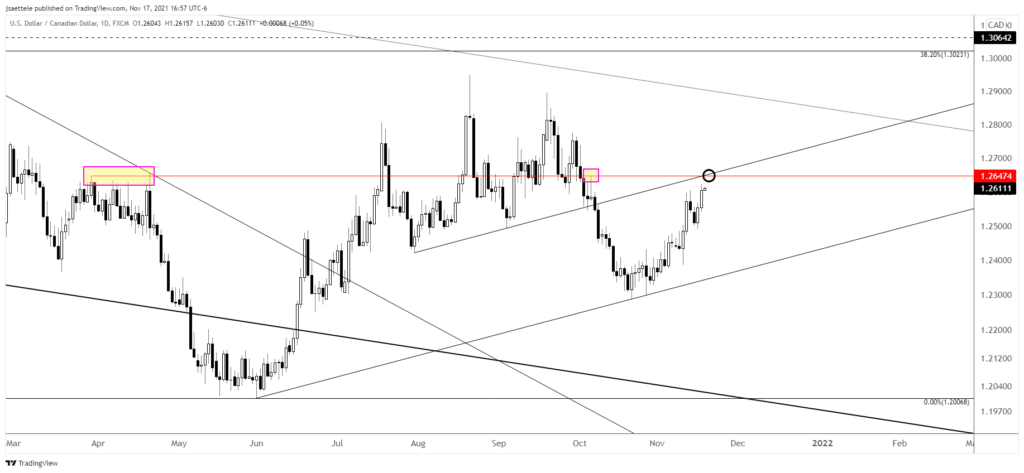
Heads up on 1.2650 for USDCAD. If a pullback is going to materialize then that’s the spot for resistance. The 10/27 high (BoC day) will be in line for support at 1.2432 if price does indeed pull back.
11/11 – The previously discussed USDCAD bearish pattern is obviously no longer valid. From a pattern perspective, I’m not sure what’s going on right now but pay attention to 1.2650 or so for possible resistance. The top side of the blue line should provide support near 1.2520 if USDCAD is bullish on a swing basis.


