Education
June 17, 2021

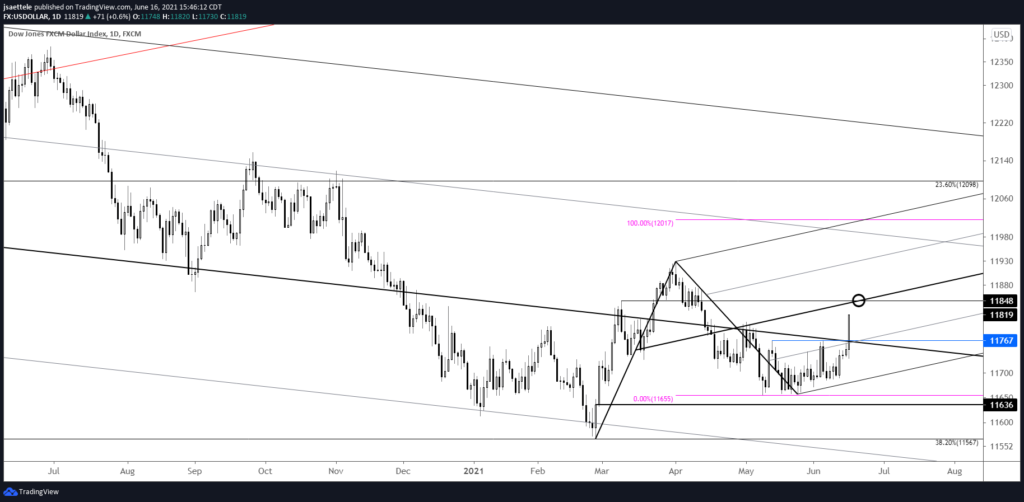
Today’s move in USDOLLAR proves us correct in the assertion that action since the beginning of the year is a bullish base. The top side of the median line is now support near 11767. A pullback is possible from the center line of the channel from the yearly low. That line is near 11848. Strategically, either wait for a pullback to 11767 or a break above 11848 (median line) and then look to buy a pullback into 11848 (or so).
May 5, 2021

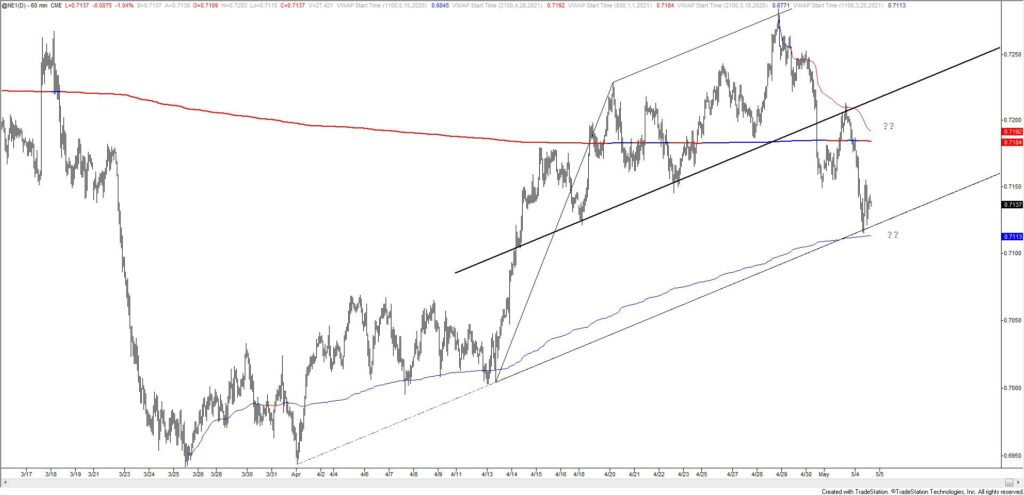
Kiwi has traded in a textbook fashion over the last week or so. Resistance at the channel high…hard break of the center line…center line acting as resistance…and finally the lower channel line holding.
February 2, 2021
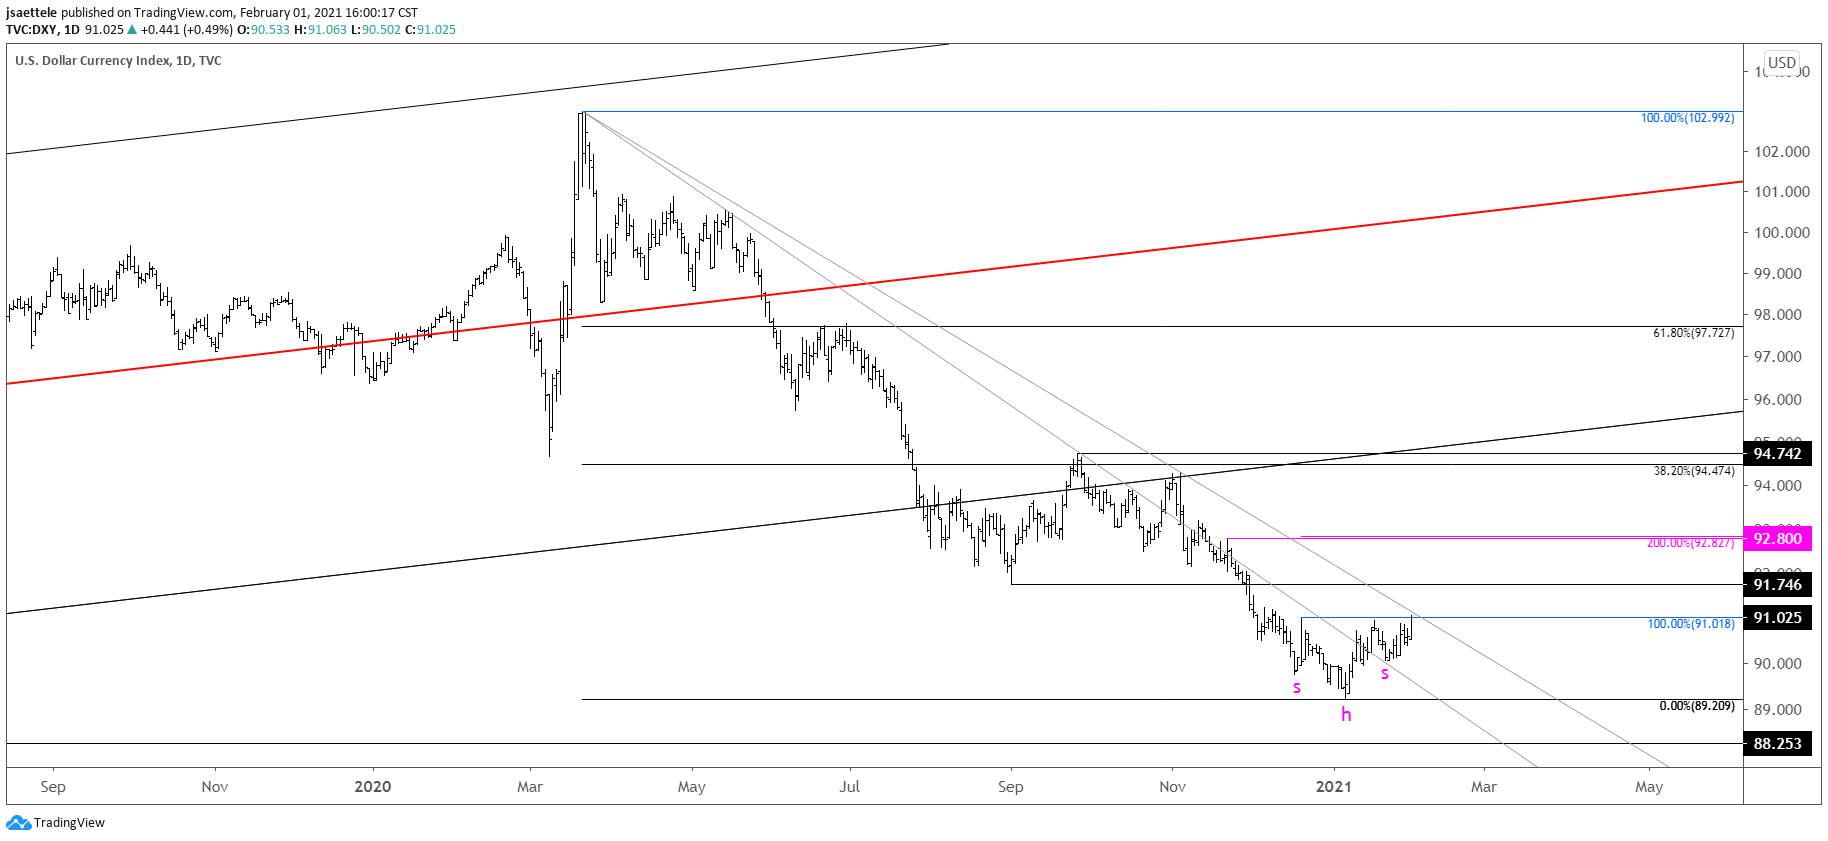
DXY is trading right at the neckline from a head and shoulders bottom pattern. The objective from the pattern is 92.80 (magenta line) but the former low at 91.75 is a possible pausing level. Ultimately, I’m looking towards the underside of former channel support. This is near 95 and in line with the March low, former 4th wave high, and 38.2% retrace of the decline from the March high (see weekly chart below).
January 27, 2021
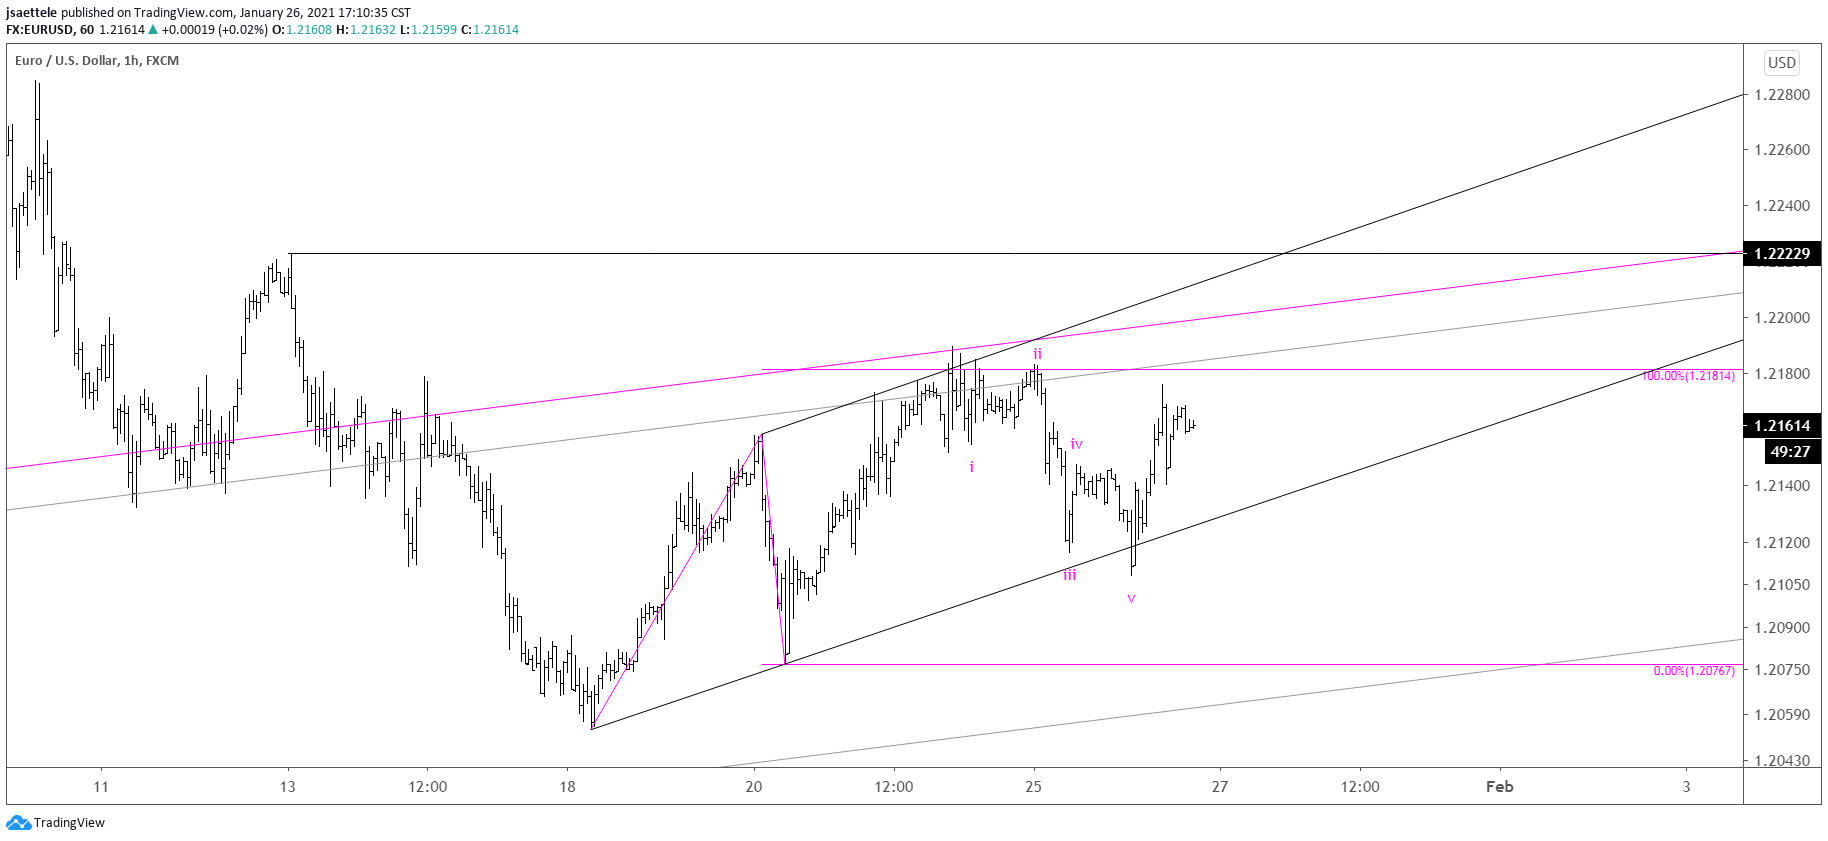
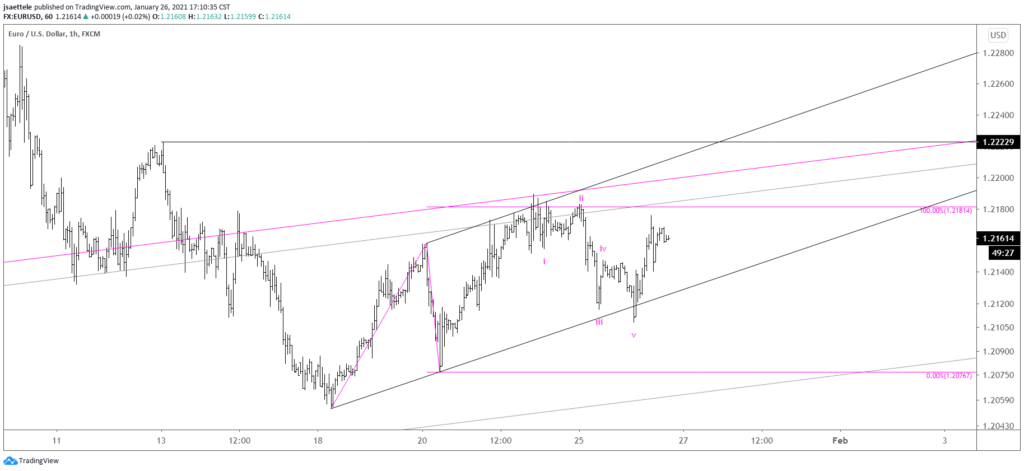
The drop from Friday’s high in EURUSD is a clean 5 waves. The implication is that price declines below 1.2108 while staying below 1.2190. Consider that the noted 5 wave decline occurred after a perfect corrective channel and a turn lower from resistance (see below) and there is good reason to be bearish against 1.2190.
January 14, 2021

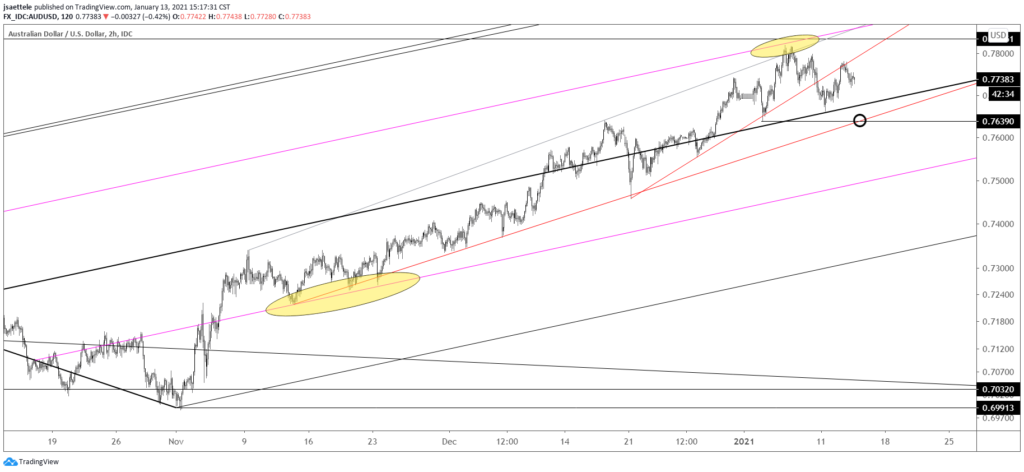
AUDUSD resistance registered at the underside of a short term trendline. The breakdown level is .7640. A drop below would open up the 25 line within the Schiff fork off of the March low. A zoomed out chart is below. Notice how the 25 line was support (in November) and the 75 line was just resistance. The concept of symmetry at work!
January 5, 2021

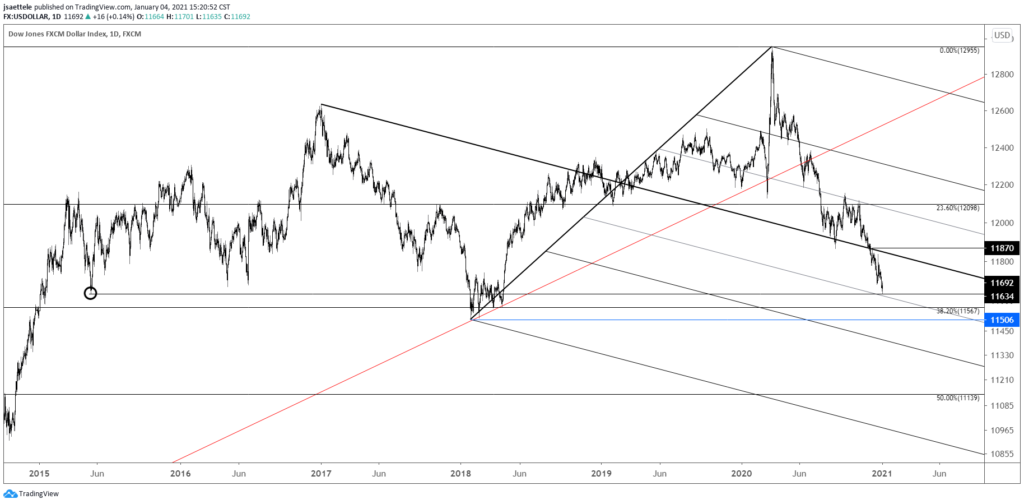
Today’s USDOLLAR low…11635. Price reversed sharply higher after low print. UUP, the USD ETF, made a high volume reversal today. The only other volume reversal on the first day of the year was in 2017, which was a high. This is only the 4th bullish reversal since inception of the ETF. The previous 3 worked. Those charts are below.
December 9, 2020

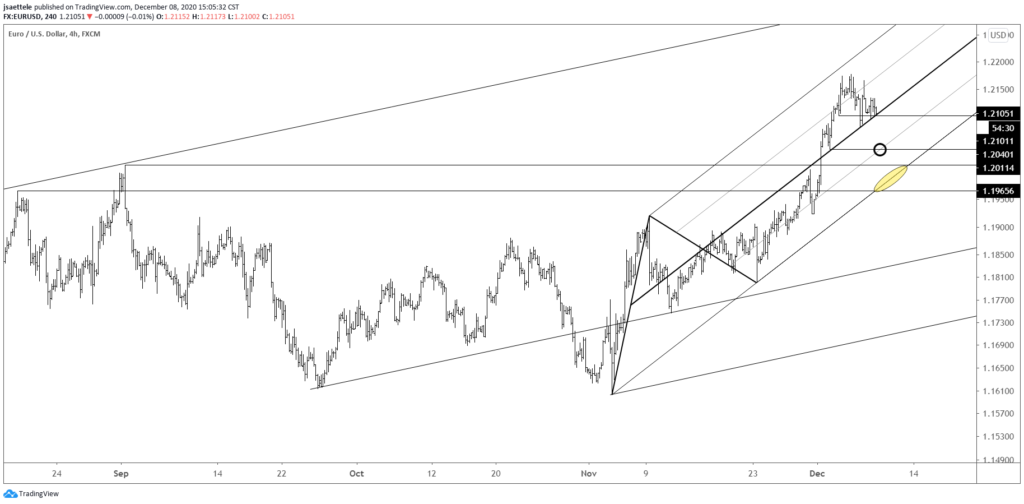
“Not a creature was stirring, not even a mouse.” That famous prose from The Night Before Christmas also applies to the FX market. EURUSD is likely waiting for ECB on Thursday so Wednesday might be another snoozer. In any case, price is sitting on the center line from the channel off of the November low. Price has bounced from this line the last two days so a break would indicate a near term behavior change. If that happens, then initial downside focus is 1.2040 and the lower parallel, which is about 1.1985 on Wednesday.
November 30, 2020

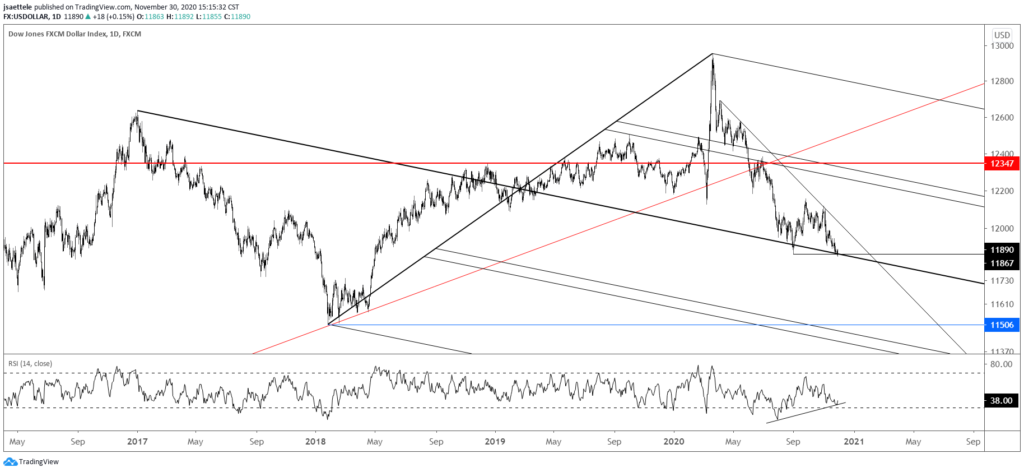
USDOLLAR reversed higher today after undercutting the September low. Importantly, price reversed at the median line…just as it did in September. Divergence with RSI attends the low, as it often does at important turns. Today was also a bullish engulfing pattern. This occurs when price opens below the prior close and closes above the prior open.
September 21, 2020
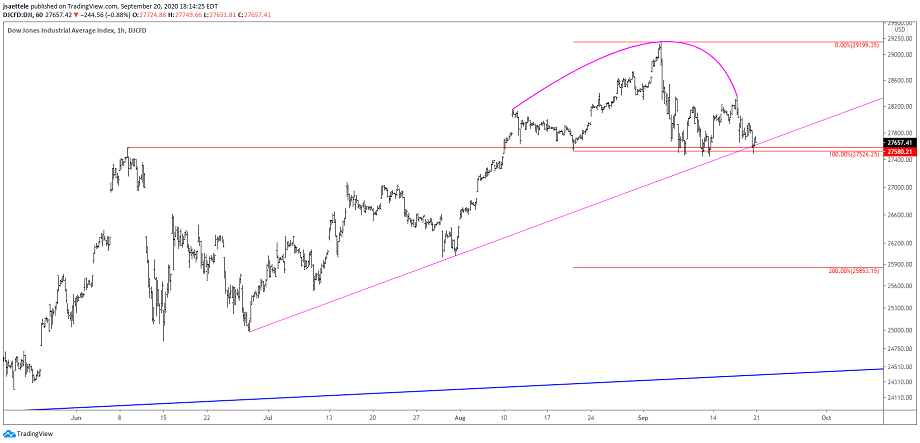
The Dow is testing critical support from the June high. This level has been support since 8/20. A break below would complete a head and shoulders top that’s been forming since early June. The measured objective would be 25853.