Education
January 26, 2021
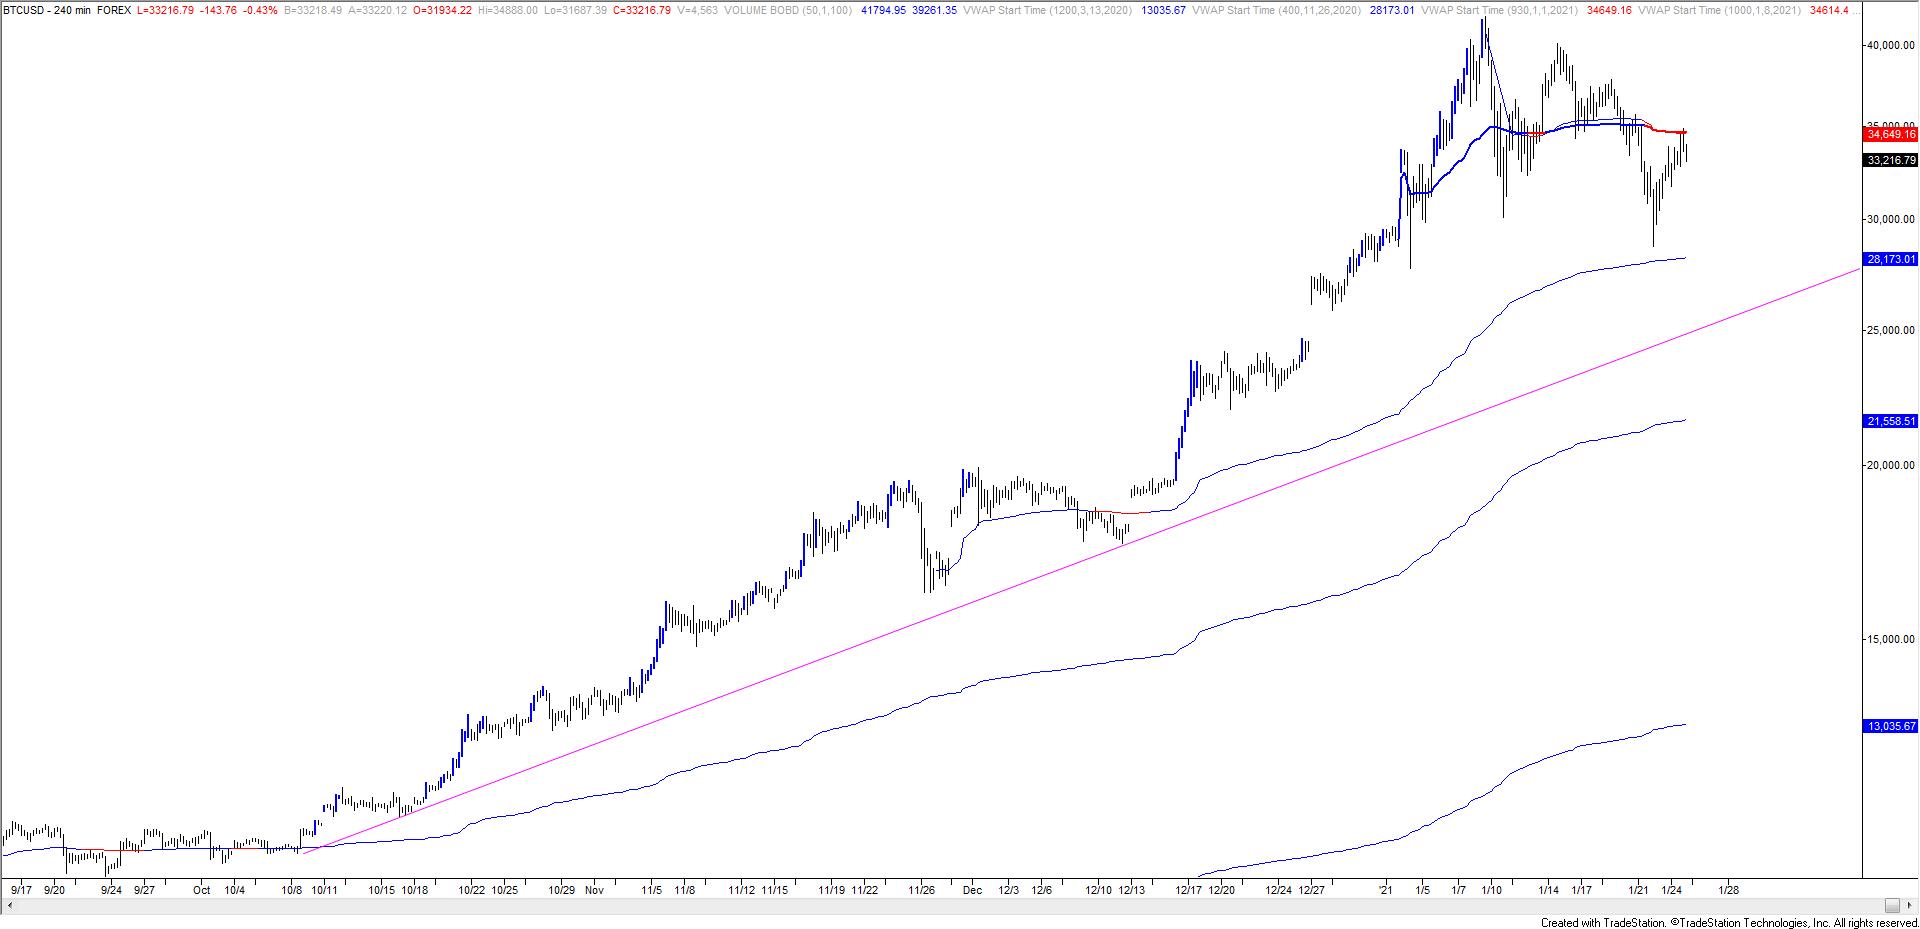
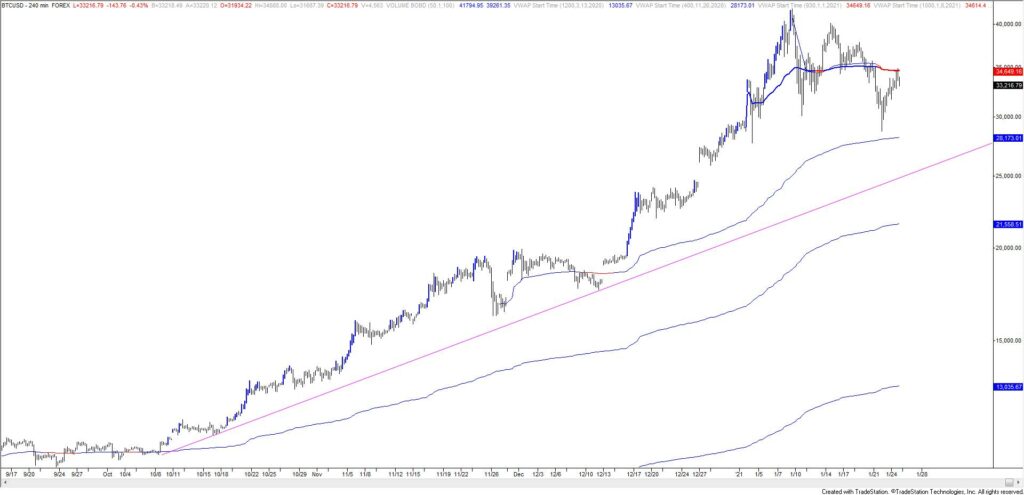
daBTCUSD bounced just before 28000 and turned down today at 34888…right at noted VWAP resistance. Resistance registered where it needed to in order to maintain that price has topped and is headed lower. Don’t forget about the 2 bar weekly volume reversal that registered last week.
January 19, 2021

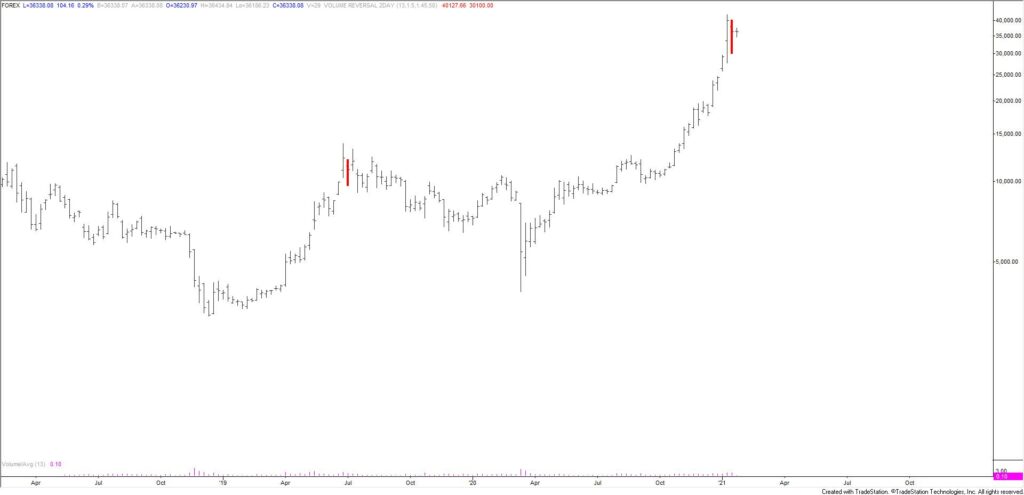
BTCUSD made a 2 bar weekly volume reversal last week. TradeStation historical is limited but this is the 2nd 2 bar weekly volume reversal since 2019. The 2019 signal identified an important top. Bitcoin news mentions have also gone parabolic (see below). This isn’t a surprise but it’s comforting to see the data. In other words, the speculative excess isn’t anecdotal.
January 8, 2021

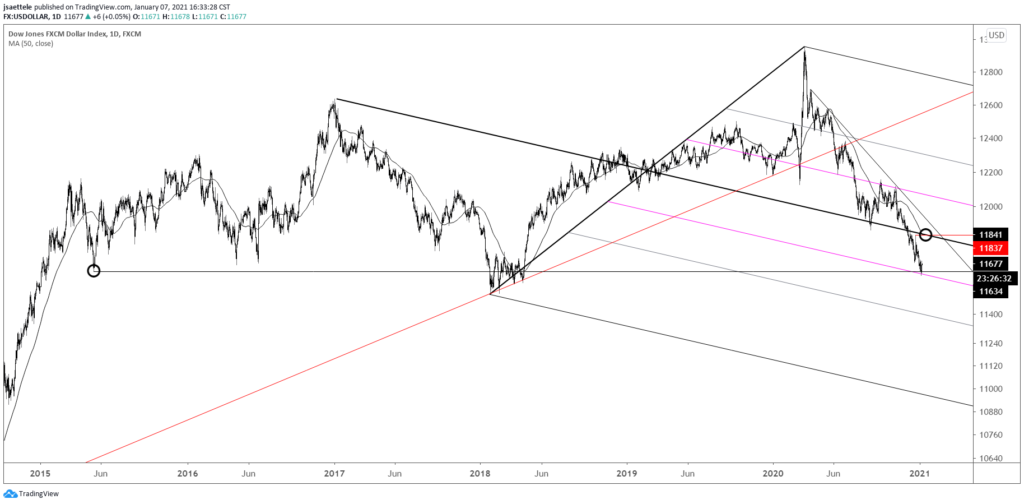
USDOLLAR continues to hold the May 2015 low. The level is also defined by a parallel that is equidistant from the parallel that was resistance in September and November (magenta lines) when measured from the median line. This is an example of symmetry that we often see in median line analysis. I am looking towards the median line, about 11840, as long as the low holds. A short term structure is shown below that is in play and worth following. 11650 is possible support.
December 30, 2020

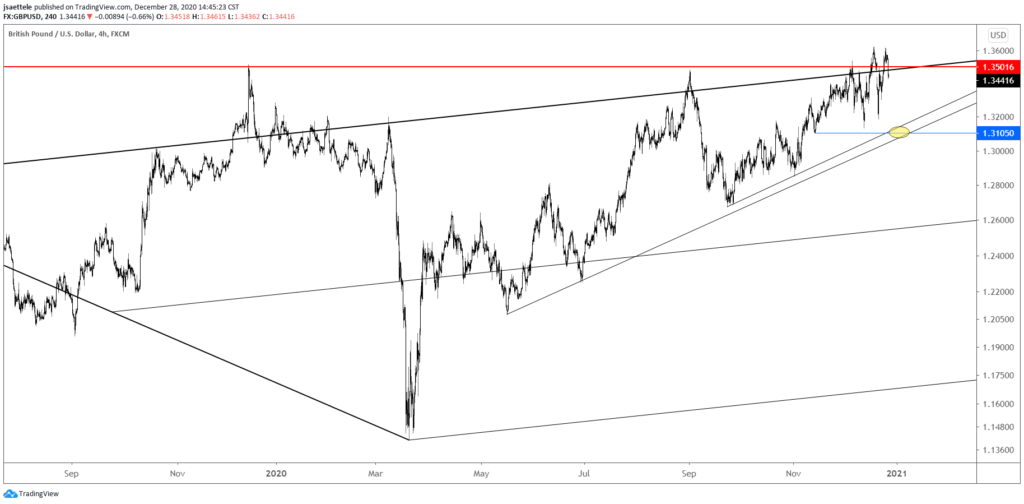
GBPUSD continues to oscillate around the critical 1.3500. A gap higher on perceived positive Brexit news was followed by weakness throughout the day…a classic ‘sell the news’ dynamic. 1.3500/25 remains proposed resistance. The top of this zone is a high volume level. Near term focus remains towards 1.3100ish. The level is defined by trendlines and is just under the 12/11 low.
December 21, 2020
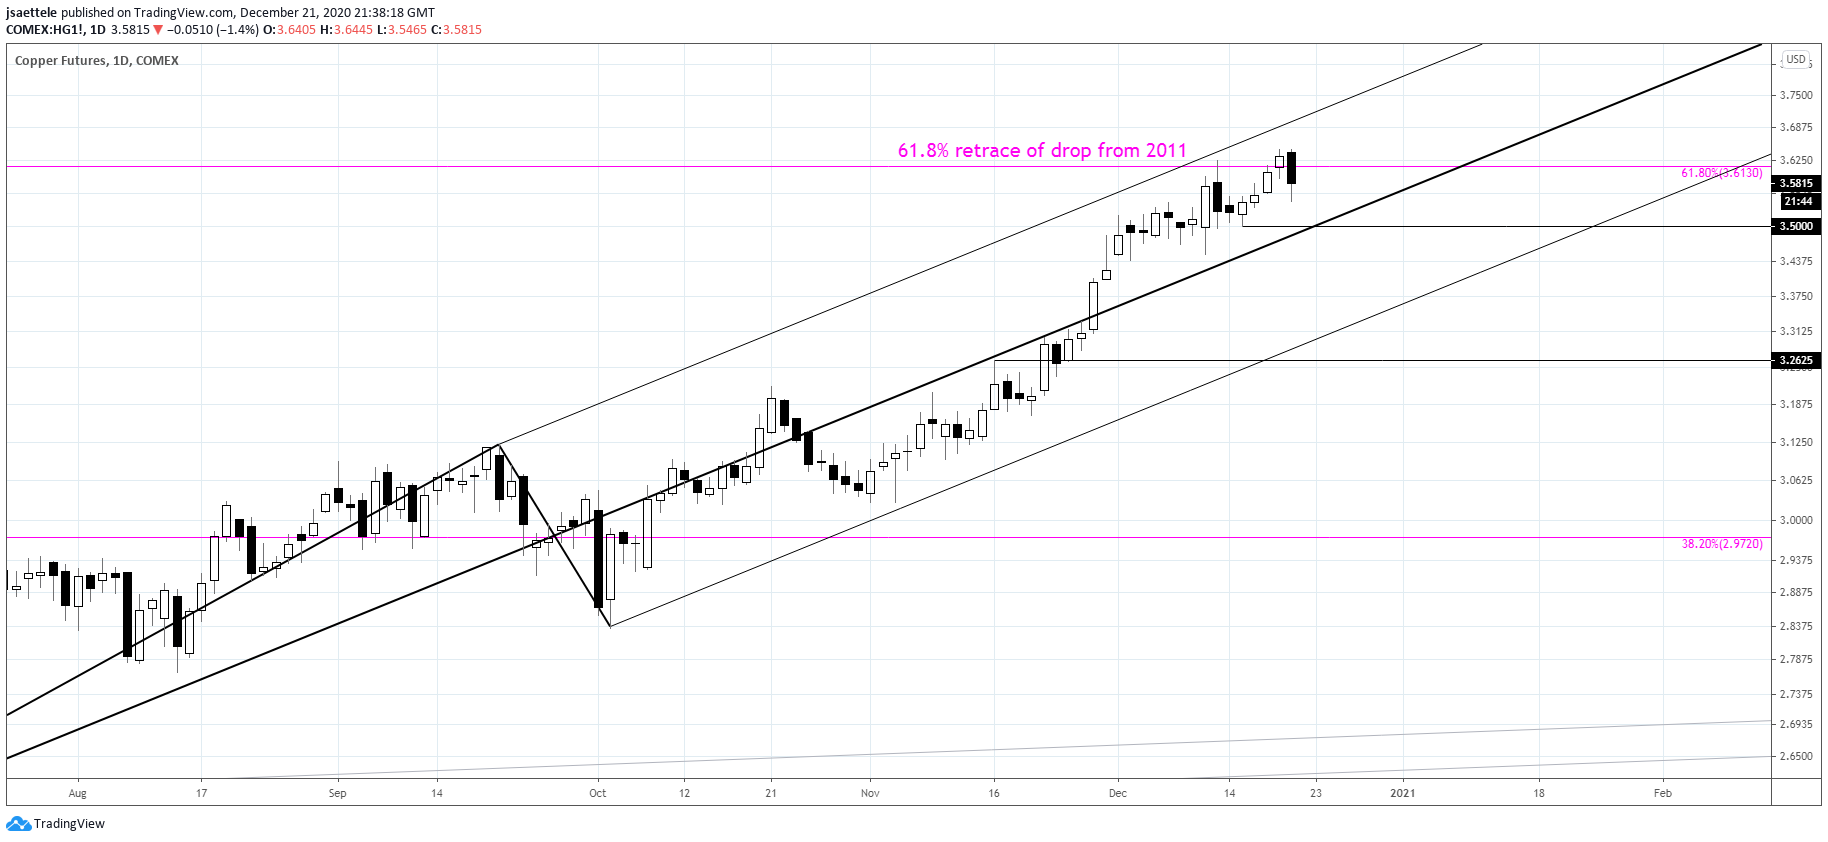
Copper continues to trade on both sides of the 61.8% retrace of the decline from 2011. I continue to follow near term levels from the channel off of the March low. The center line is about 3.50. That needs to break in order to suggest that copper is lower, probably until the lower parallel.
December 21, 2020

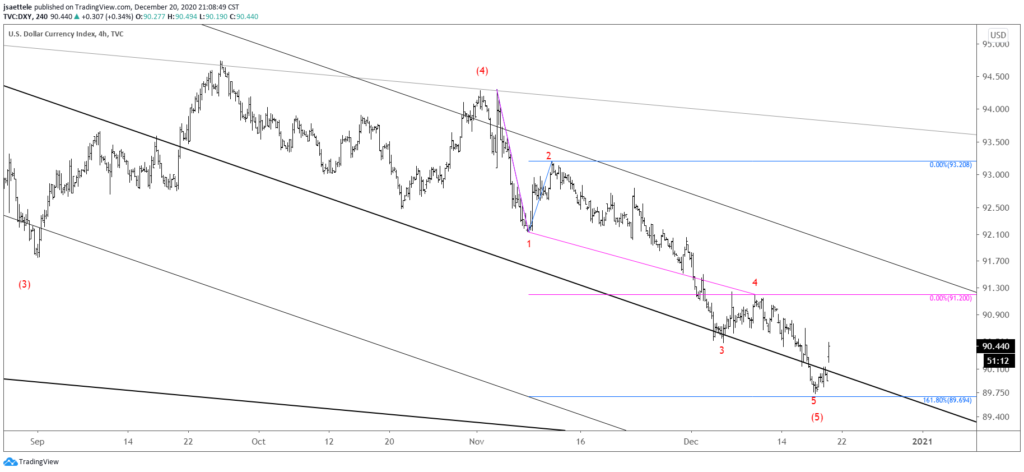
DXY is up sharply in early week trading, raising the specter that wave ‘5 of 5’ is complete at last week’s low. If the rally stretches into 5 waves, then focus will be on buying a small pullback for what likely proves to be a multi-month rally in order to correct the entire decline from the March high. Stay tuned.
December 17, 2020

DXY nearly reached 90.02 today. Low was 90.13 and price reversed until FOMC, after which the buck was no longer allowed to rally. I maintain that reversal risk is high from this level (90.02). Note also the blue lines that connect lows since October 2019.
December 15, 2020

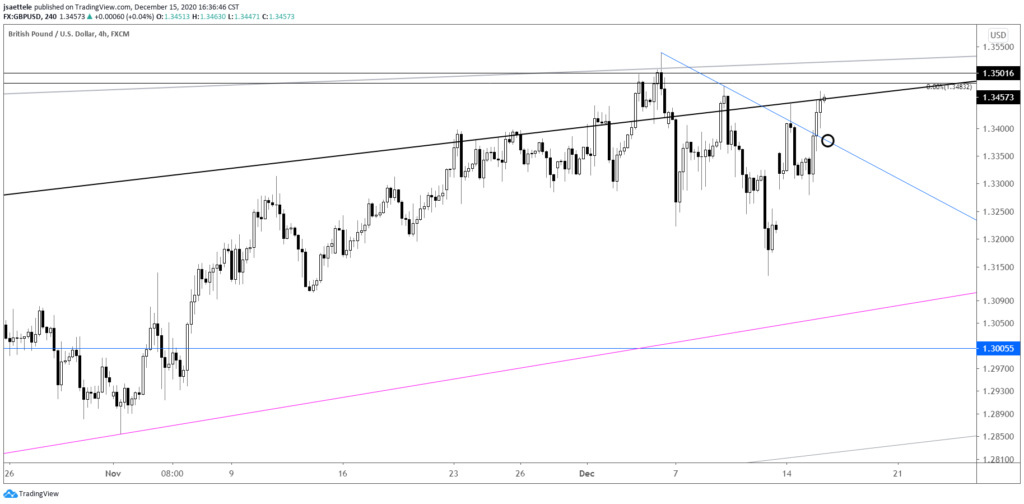
As noted yesterday, the GBPUSD drop from 12/4 to 12/11 is in 2 equal waves. The implication is that the drop is corrective, although it could also compose the first leg of a complex correction. In any case, keep an eye on the top side of the just broken channel. That line is about 1.3380. If that holds as support, then I’d consider longs for a potentially massive breakout as a move above 1.3500 would shift focus to the 2007-2014 line near 1.4050
November 23, 2020

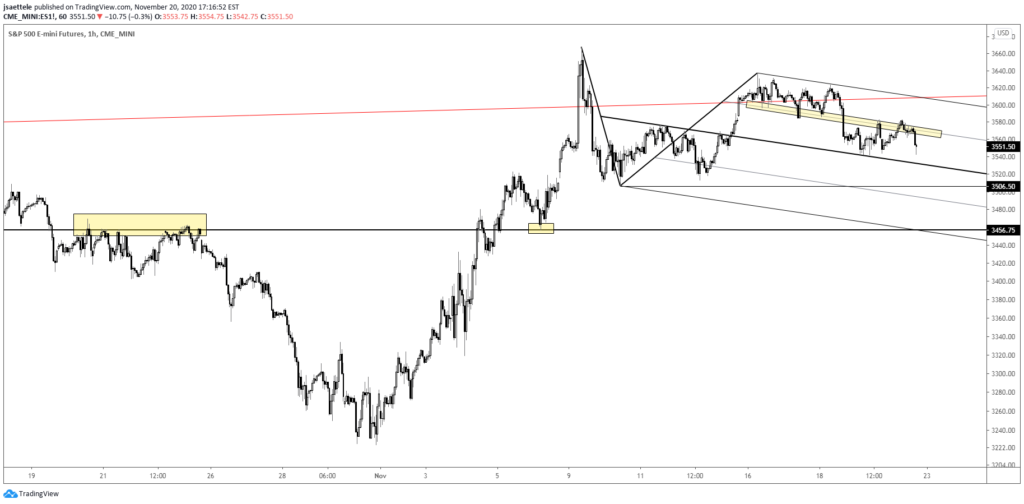
S&P 500 futures continues to stairstep lower. I am looking lower. Price ideally stays under 3583. Initial focus is 3456.75 with 3506.50 as a possible bounce spot. On the sentiment front, hedge funds are all in and short interest is at an all-time low (see charts below).