Education
March 31, 2021
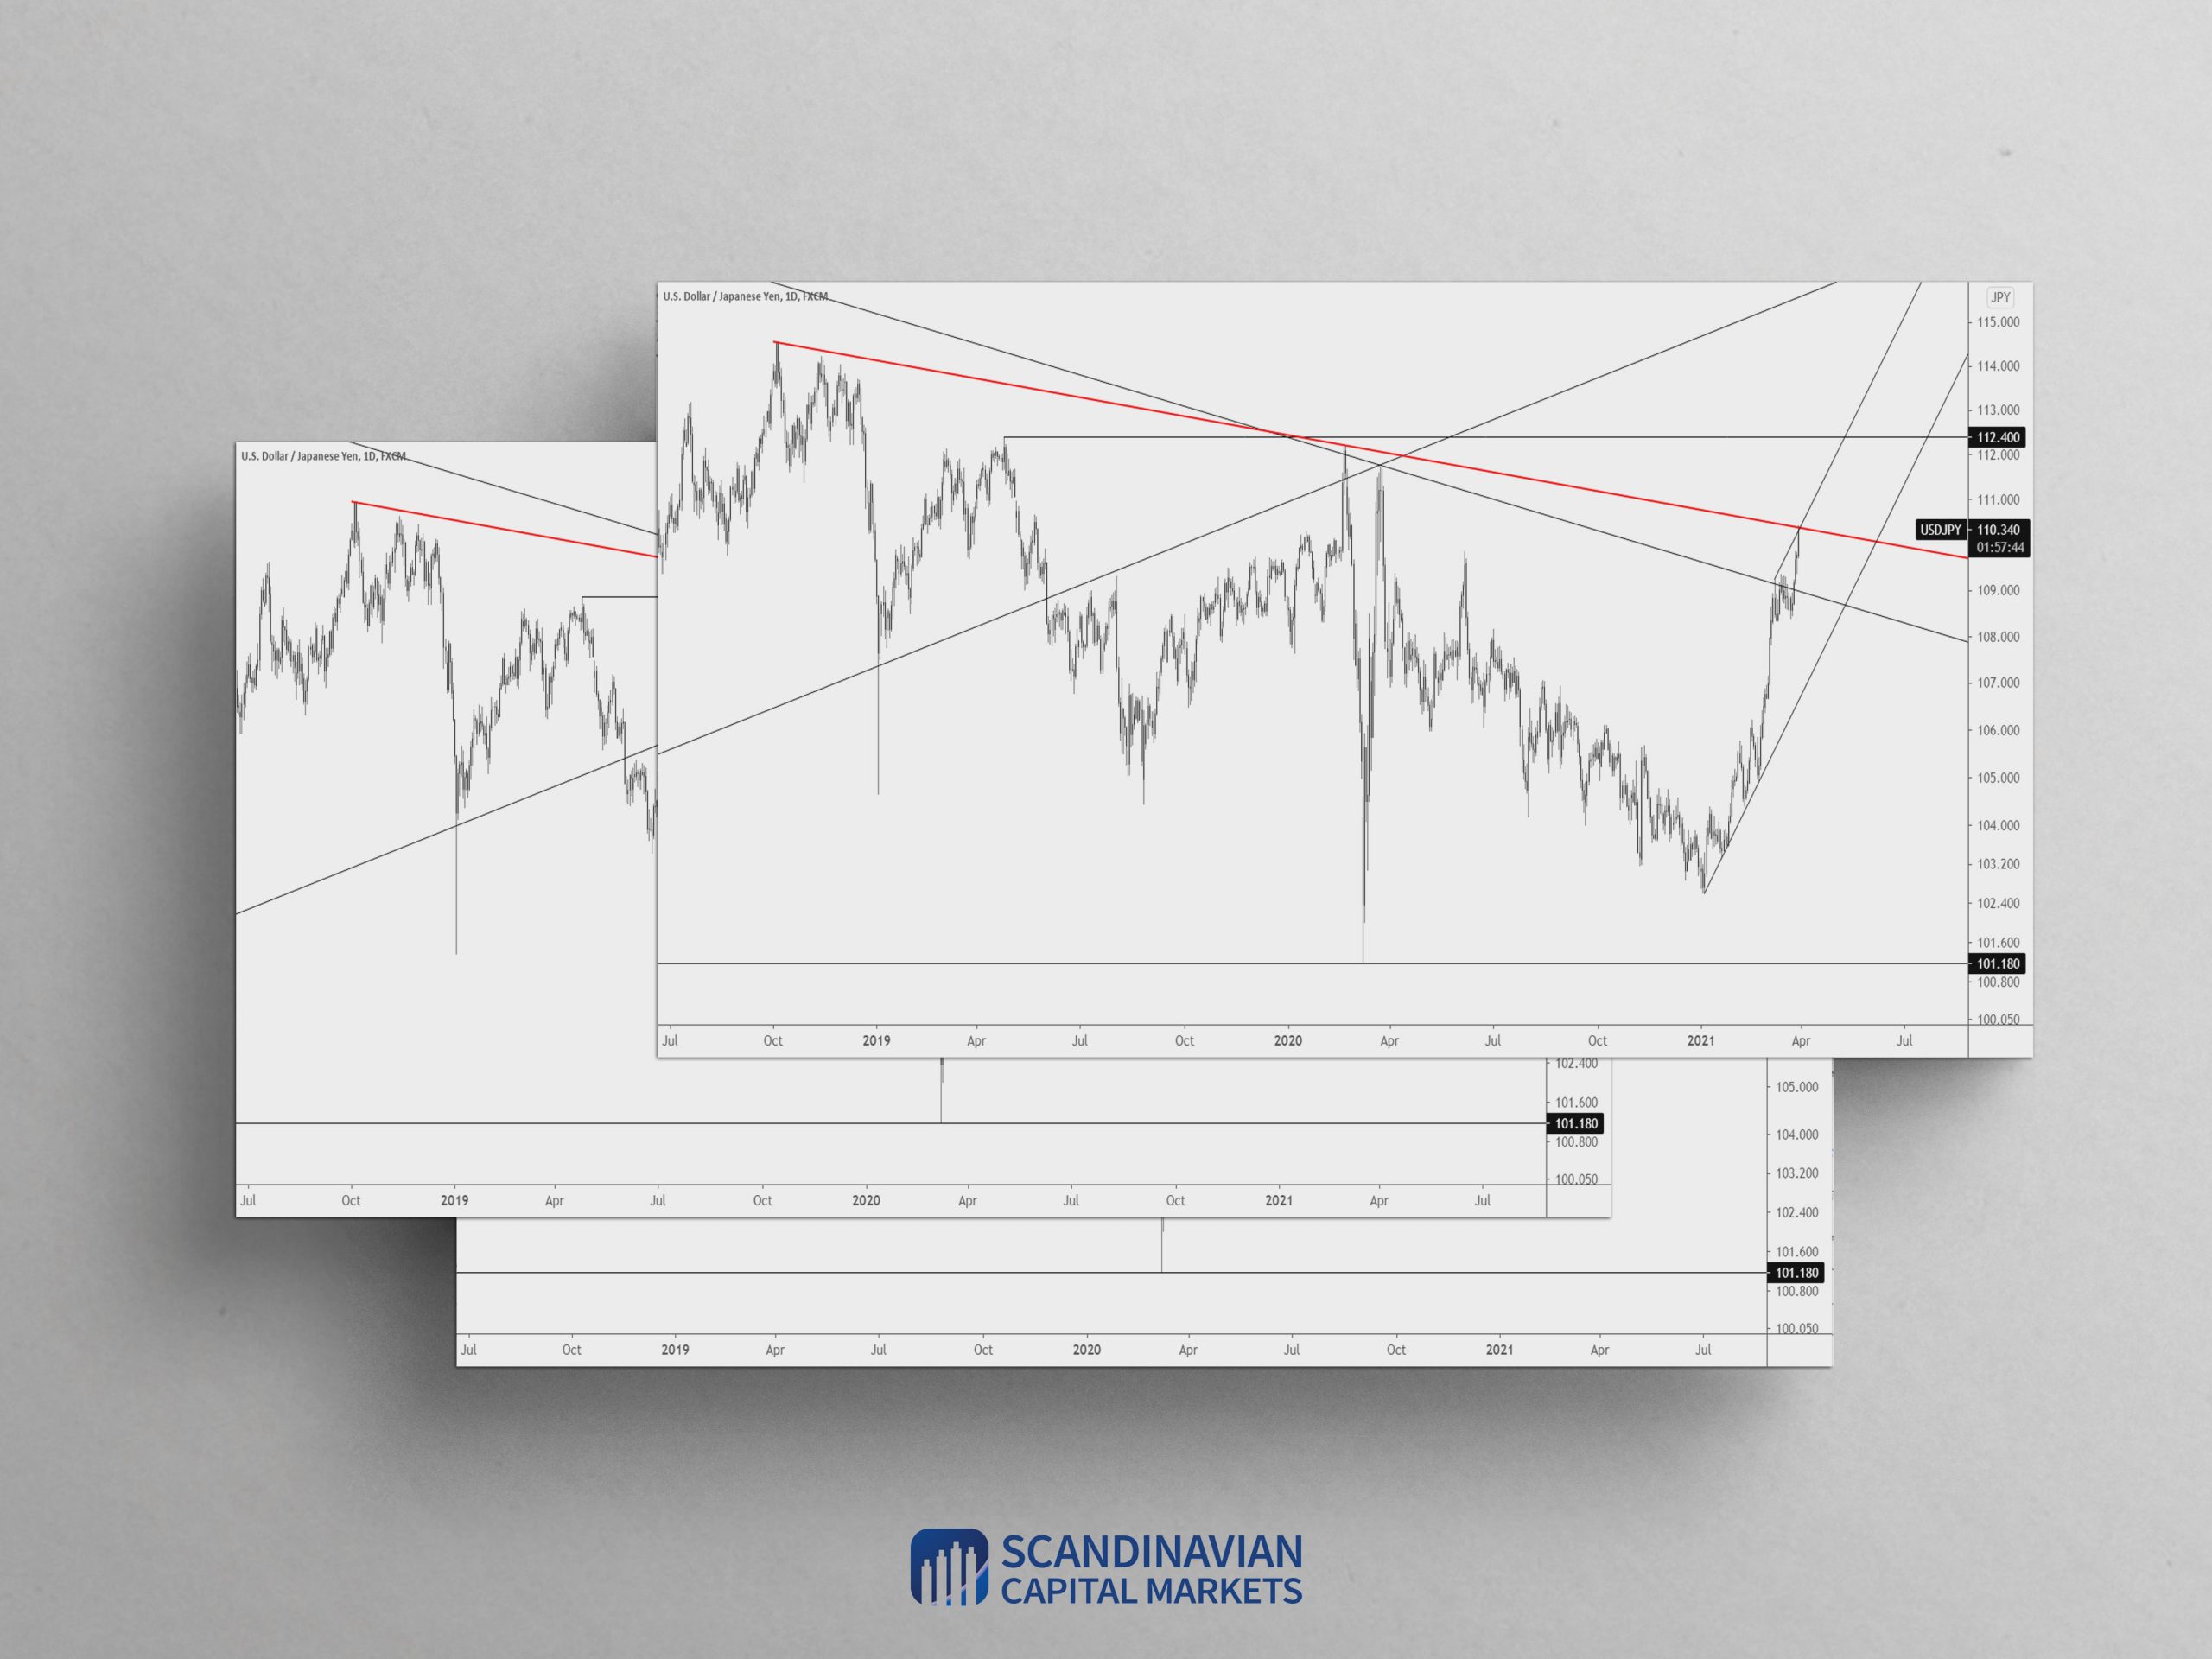
USDJPY continues to rip higher but price has reached an interesting level. The level in question is the line that extends off of the 2018 and 2020 highs. Seasonal tendencies also top this week. This trendline/seasonal combination makes for a great opportunity to fade the move but we need price to suggest that some sort of a top is in place. An intraday volume reversal for example would suffice.
March 24, 2021

The break above the median line in USDOLLAR is significant! The top side of this line should provide support now near 11810. The September low at 11867 is possible resistance for a pullback/pause but general focus is on the parallel that was resistance in Q4 2020 (then reassess). That line is about 12030. The long term view is shown below for context.
March 16, 2021
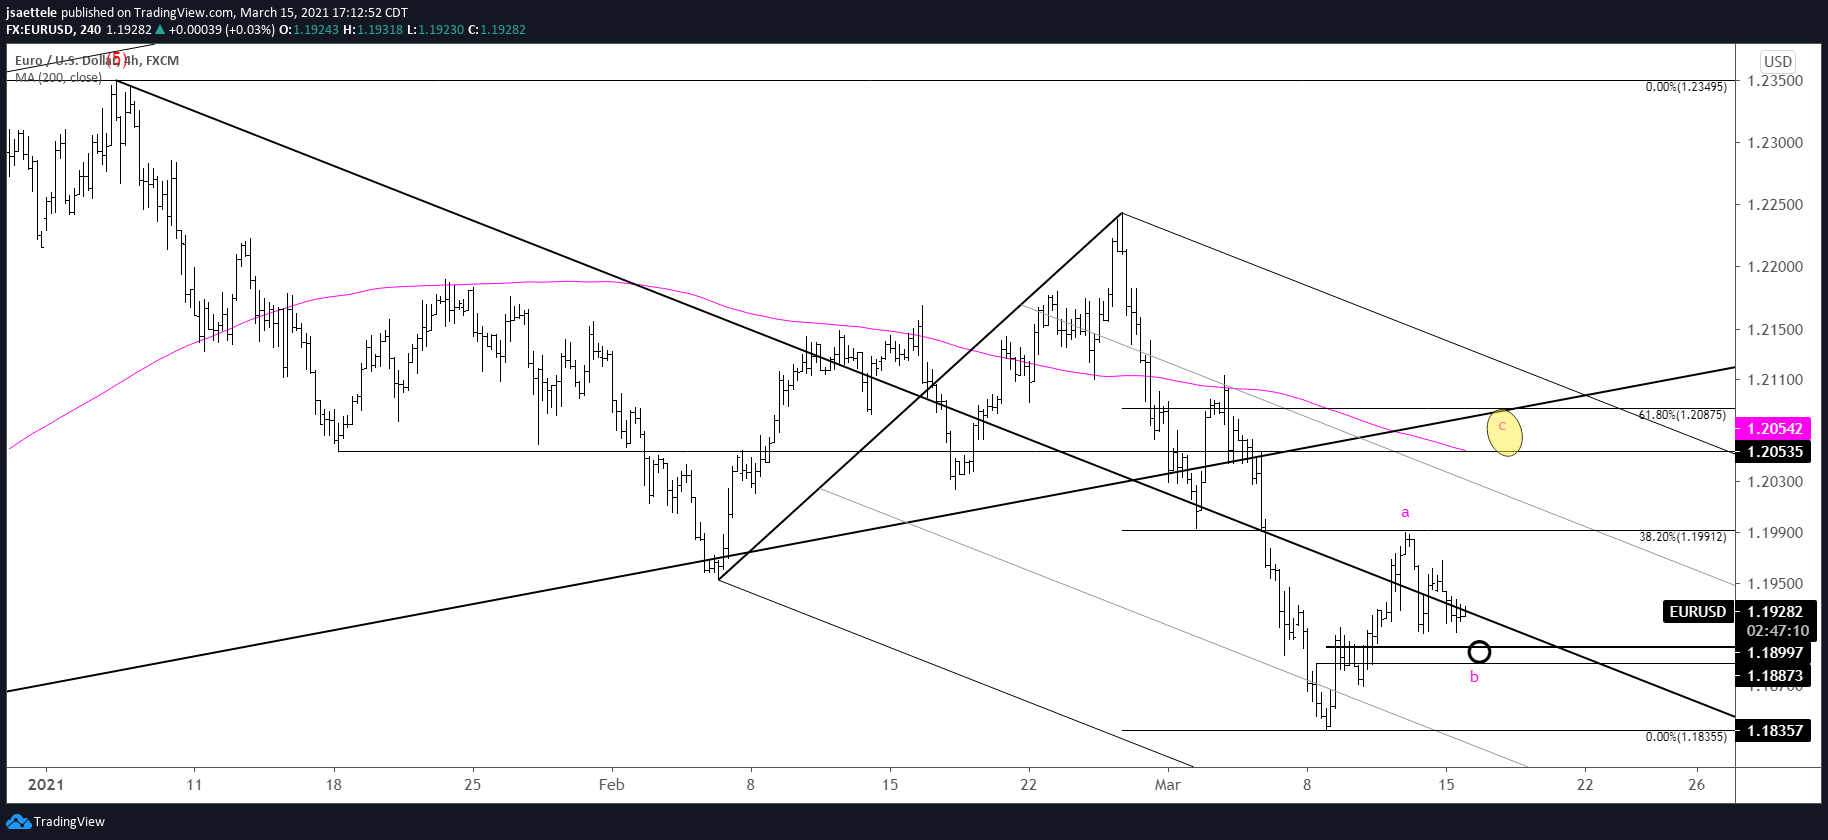
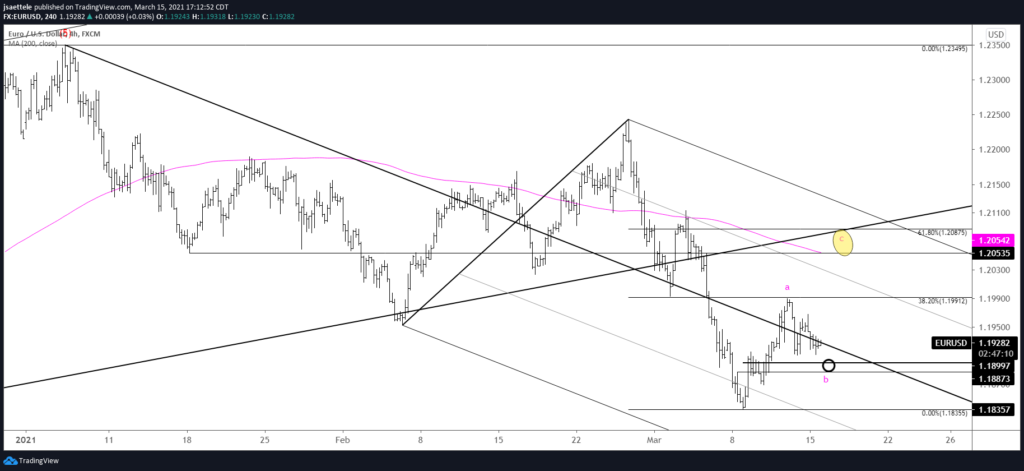
EURUSD may be working on a 3 wave rally from the 3/9 low. Proposed support for wave B is just under 1.1900…1.1887/99 is daily reversal support, the 61.8% retrace of the rally from the low, and 2 equal legs down from the 3/11 high. If this interpretation is correct, then price will rally into 1.2050/90 (month open is 1.2070 as well).
March 10, 2021

USDJPY nailed resistance and reversed (high today was 109.23). Simply, I am looking lower until roughly 107.00 (the next decision point?). Proposed resistance is now 108.80ish.
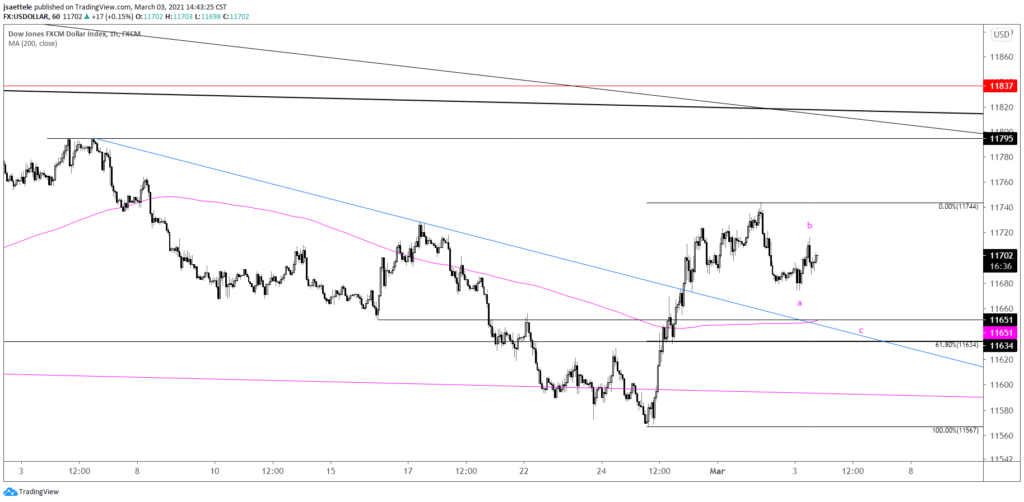
March 4, 2021

A well-defined base has formed in USDOLLAR since mid-February. Zooming into price action since the 2/25 low reveals an impulsive advance followed by a drop and today’s bounce. I’m of the mind that the drop and bounce compose waves A and B of a 3 wave pullback. Ideal support for the end of the pullback is 11634/51.
March 1, 2021
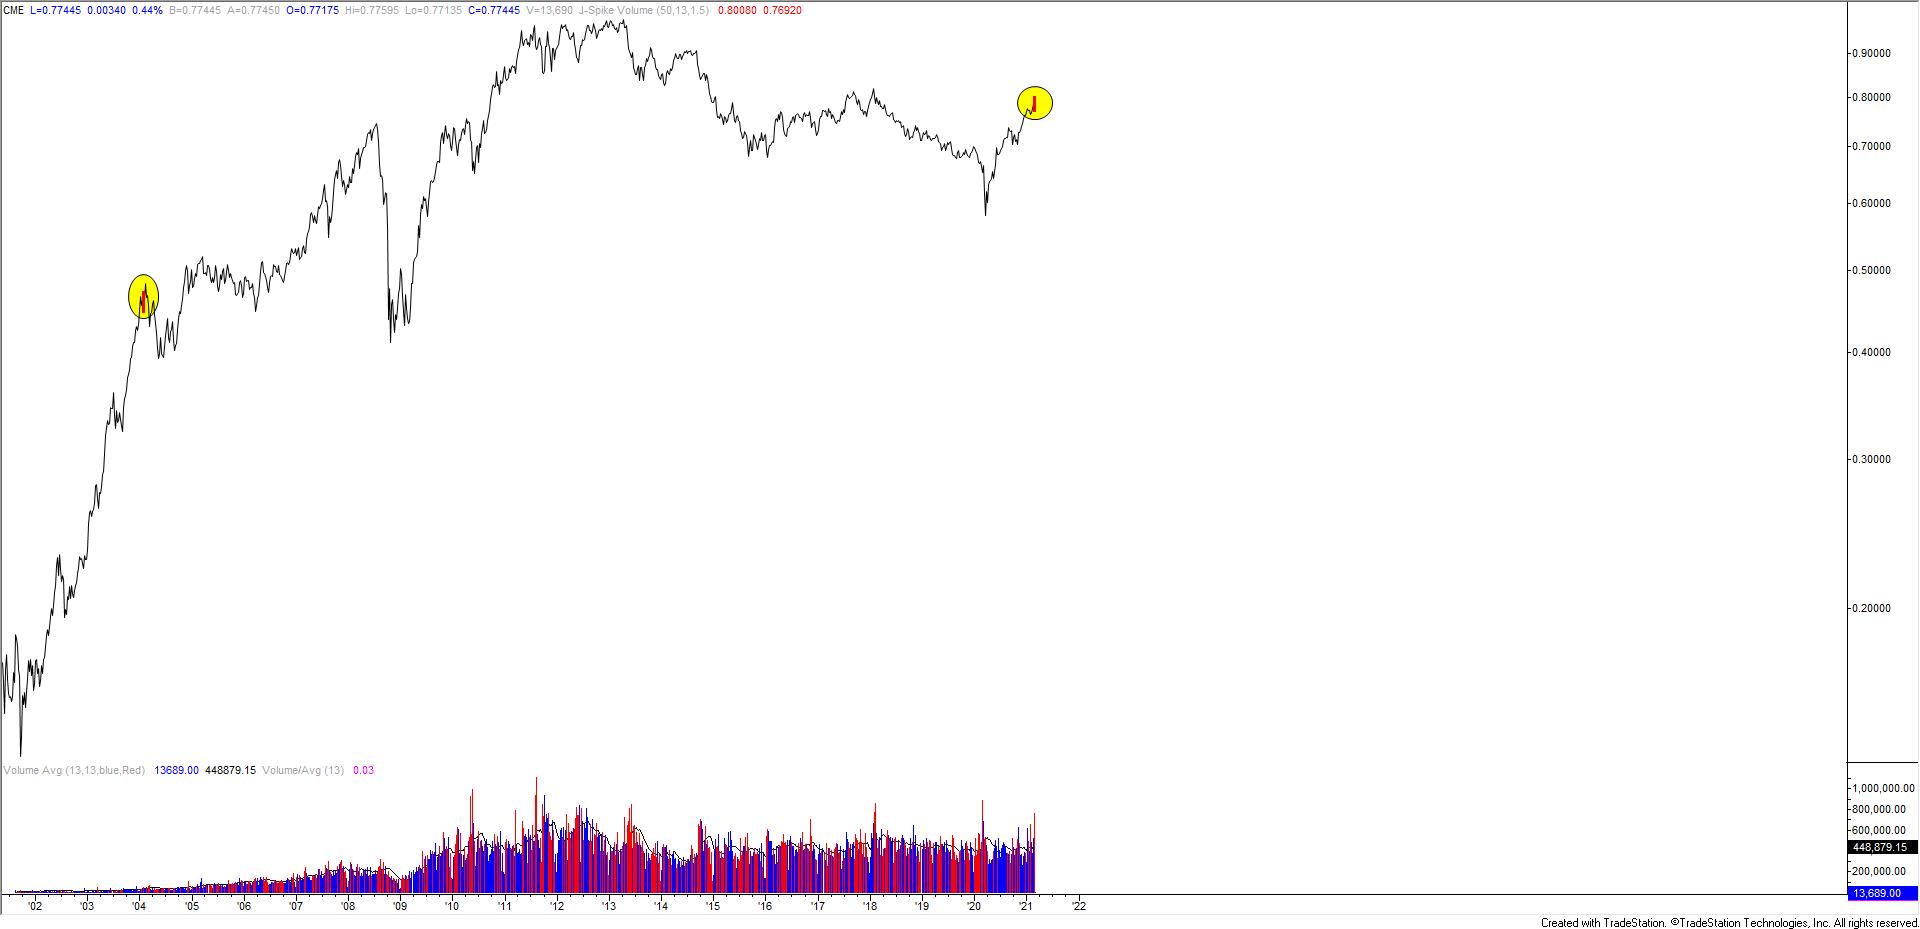
AUDUSD followed through on its daily reversal last week and ended up with a weekly volume reversal. The only other weekly volume reversal occurred at the January 2004 high. Price is bouncing from the 50 day average in early week trading. Proposed resistance is .7887, which is the 61.8% retrace of the decline and the center line of the Schiff fork from the March low (see below chart). The next downside level of interest is the lower parallel. That is currently near .7500.