Education
August 18, 2020
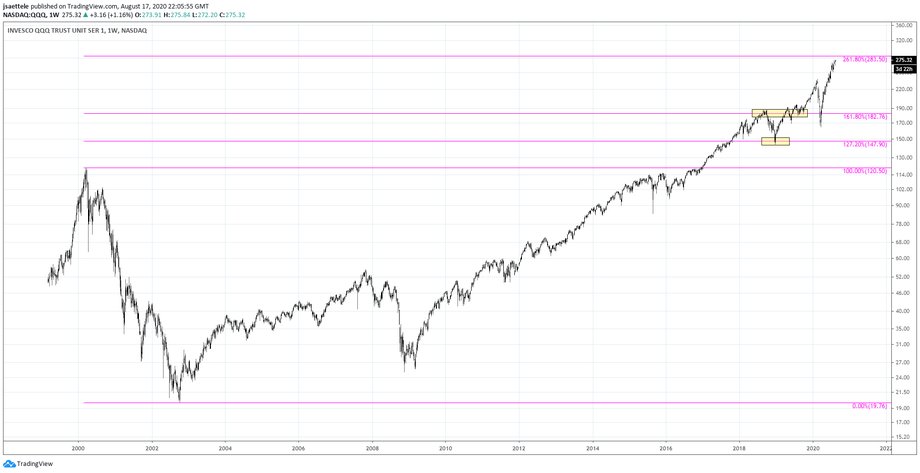
Be aware of the 261.8% expansion of the 2000-2002 decline in QQQ at 283.50 as potential resistance. That’s about 3% higher. The first 2 Fibonacci levels, 127.2% and 161.8%, presented several opportunities (close up view is below). The equivalent level in the Nasdaq Composite Index is 11643.40, which is 4.6% higher than today’s close (2 charts down).
August 17, 2020
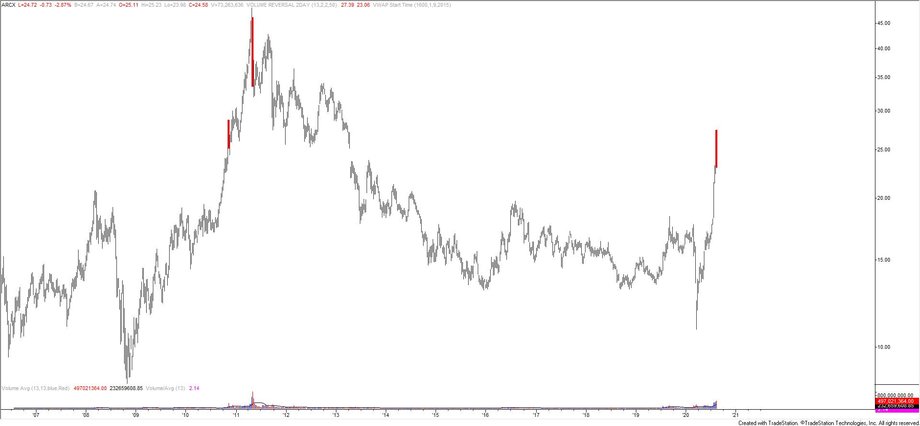
Silver made a 2 bar weekly volume reversal last week. Volume reversal logic is explained here. The only other signals with the same volume requirements occurred in December 2010 and April 2011.
August 7, 2020
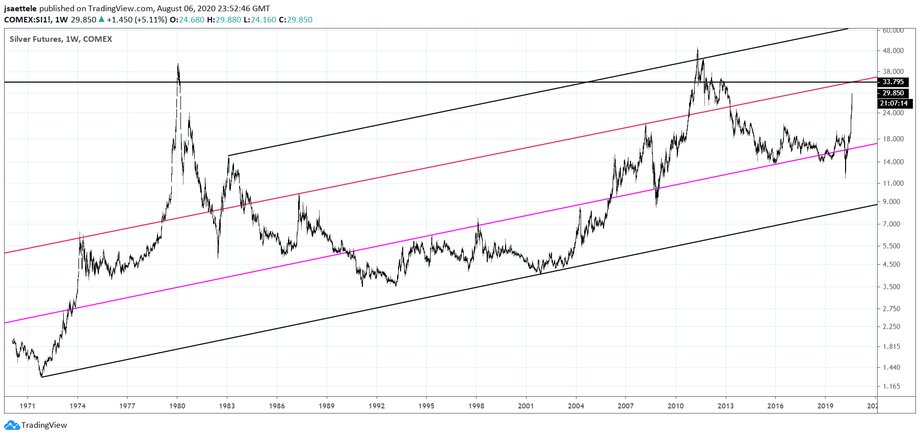
After some back and fill, silver blew through 26. The recent parabolic move could run into a ceiling near 33.80. This is based on a parallel related to the 1971-2001 trendline. This parallel crosses highs in 1974, 1987, and 2008.
August 6, 2020
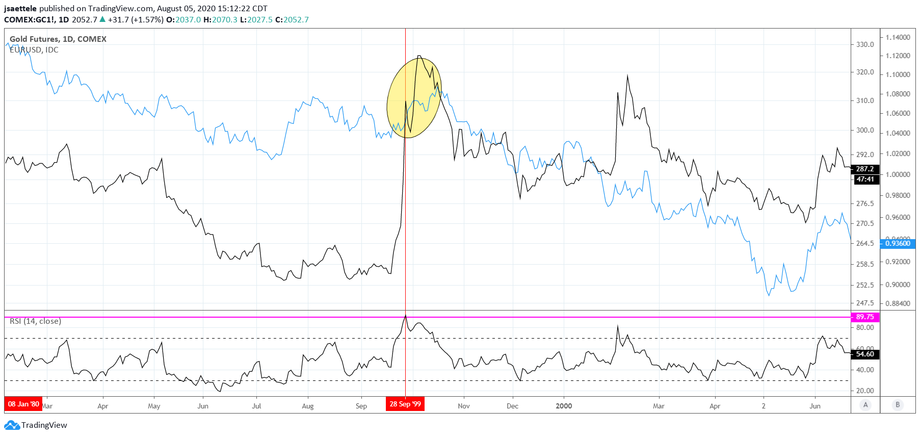
Expanding on yesterday’s gold chart (remember that the Fibonacci measurement is 2095…today’s high was 2070…), daily RSI is now 89.8. The indicator has been this high just twice before; January 1980 (twice) and September 1999.
August 5, 2020

There are similarities between the current gold rally and the rally into the 2011 top. Price has met the line off of the February and August 2019 highs (highs of proposed waves 1 and 3).
August 4, 2020
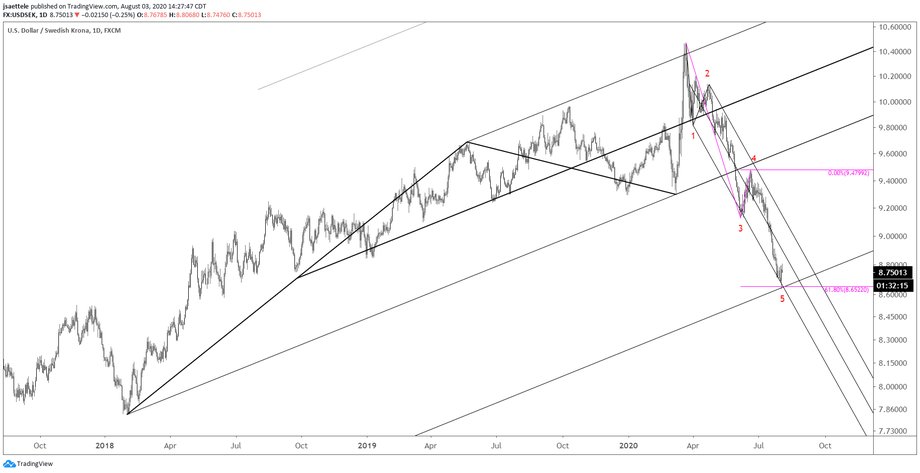
USDSEK nailed support and reversed higher on Friday from the noted channel extension and Fibonacci relationship. I’m looking for a sizable rebound in the coming weeks and maybe longer. Near term levels to pay attention to are the center line of the channel from the March high near 8.89 and the upper parallel, which is currently about 9.10.
August 3, 2020
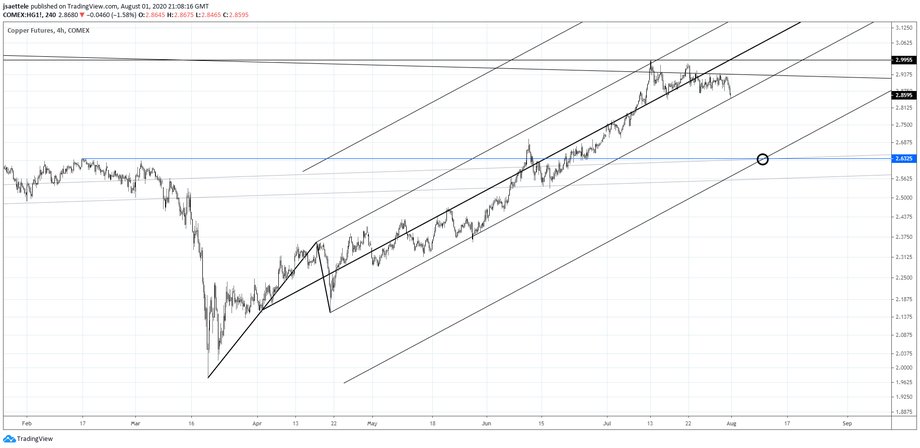
Copper begins the week at the lower parallel from the Schiff fork off of the March low…an important spot. If it breaks, then downside focus is 2.6325. Recall that copper put in a high 3 weeks ago at a major level (see weekly chart below).
July 31, 2020
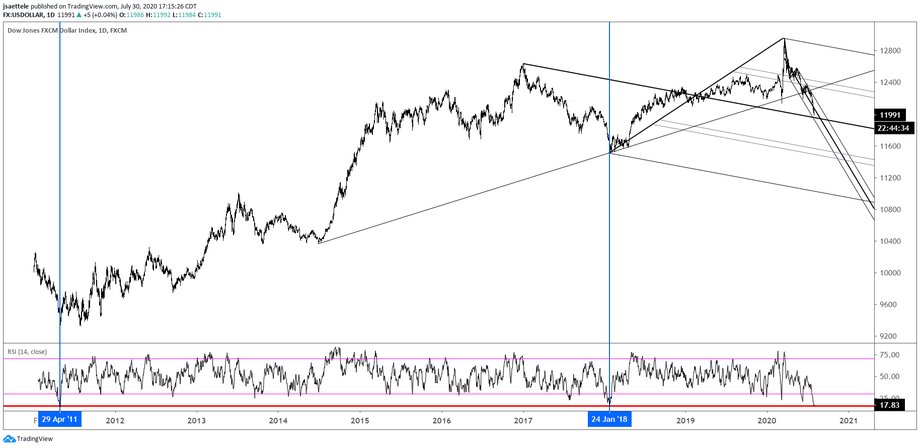
USDOLLAR daily RSI is 16.53. It’s only been that low twice (date since 2011); at the April 2011 low and the January 2018 low. Levels wise, the median line of the fork from the 2017 high is about 11950 (see close up below), which is in line with the lower parallel of the Schiff fork from the March high. It’s a logical place for a reversal.
July 30, 2020
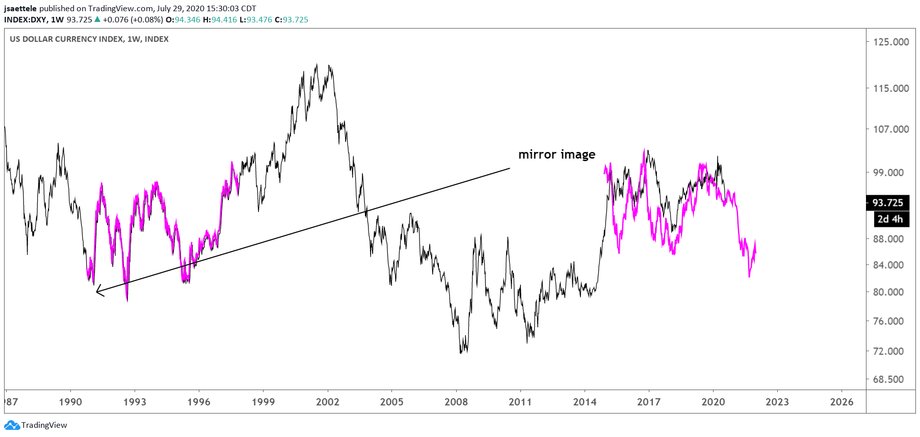
This is an analog that we’ve been following for several years. The mirror image of DXY price action from the February 1991 low closely matches price action from the March 2015 high. Figure out ‘why’ if you want but it continues to ‘work’ and I’m intrigued because the analog suggests consolidation through year end before the USD takes a digger in 2021. A close-up view is below.