Education
November 10, 2020

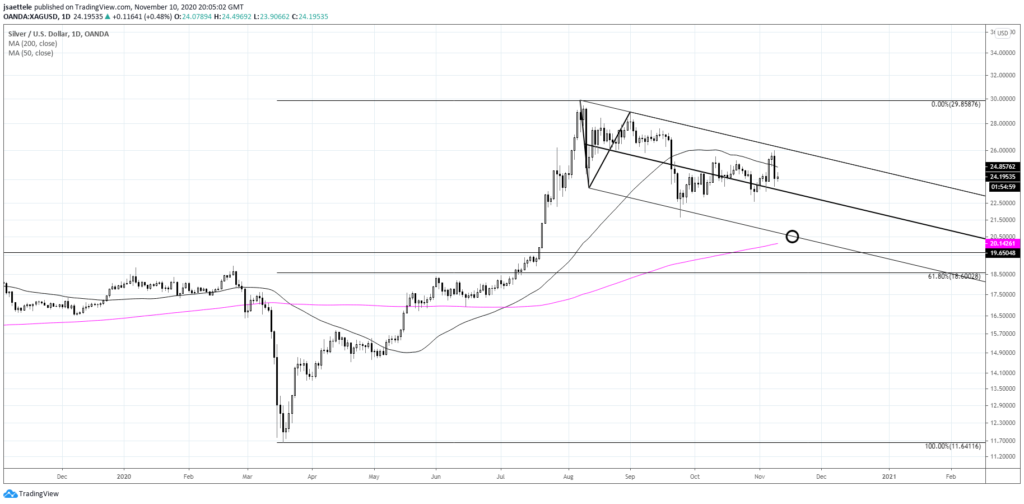
Silver has been trending lower since August 6th and put in a large bearish outside day on Monday. Focus is towards the lower channel line near 20.65, which is currently just above the 200 day average. Resistance should be about 24.56 (see 4 hour chart below). A downside bias is reinforced by the fact that VWAP from the high was resistance on SLV on Monday (see 2 charts down).
November 9, 2020

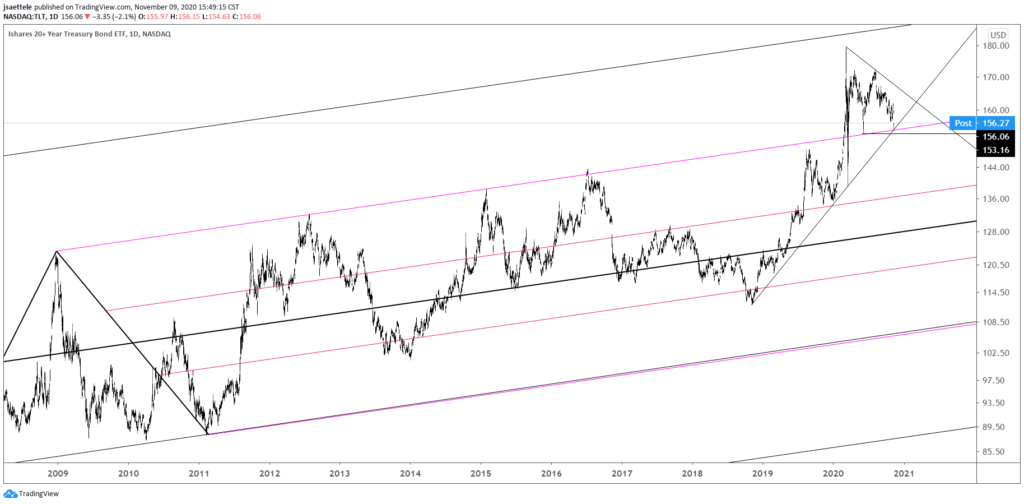
TLT has reached the long term parallel that was noted as the ‘critial level to pay attention to’ several weeks ago. Simply, this is a major decision point. Weakness below would be a game changer but support is support until broken so I’m thinking bounce.
November 9, 2020
DXY continues to trade at/just above a major long term level. Nothing has changed. This is support until broken (daily closing basis at least). The UUP (see below) warns that last week’s drop is a trap. The red bars on the UUP chart show when price closed at a 52 week low with volume at least as high as it was last week (1.8 x the 13 week average). Every instance except one (highlighted in yellow) was a capitulation low. Stay tuned.
November 2, 2020

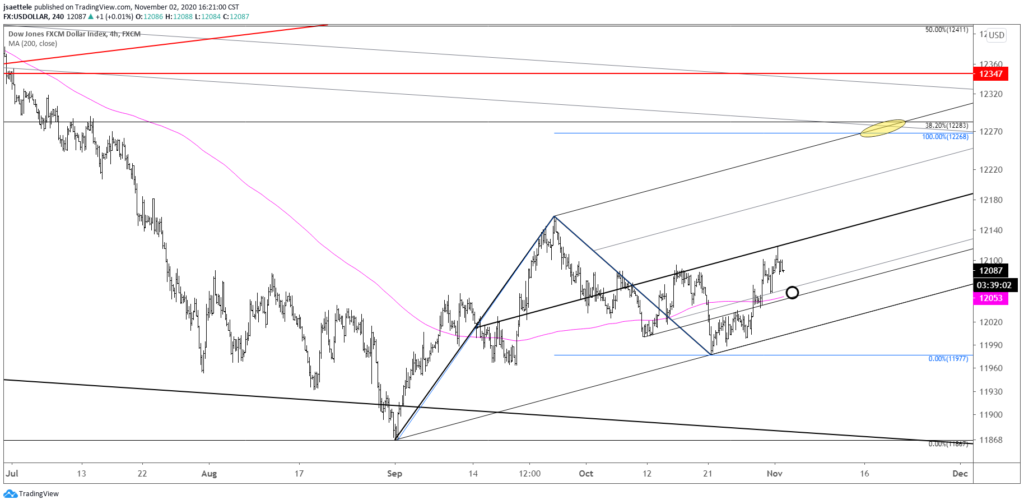
USDOLLAR traded into the center line of the channel from the September low today and immediately pulled back. Proposed support is 12050 or so. The top of the channel intersects where the rally would consist of 2 equal legs at 12268 on 11/18. The 38.2% retrace of the decline from the March high is just above there at 12283 and the 200 day average is currently 12284 (see below). So, a slight pullback and then higher? It certainly ‘fits’ with general seasonality and election seasonality.
October 29, 2020

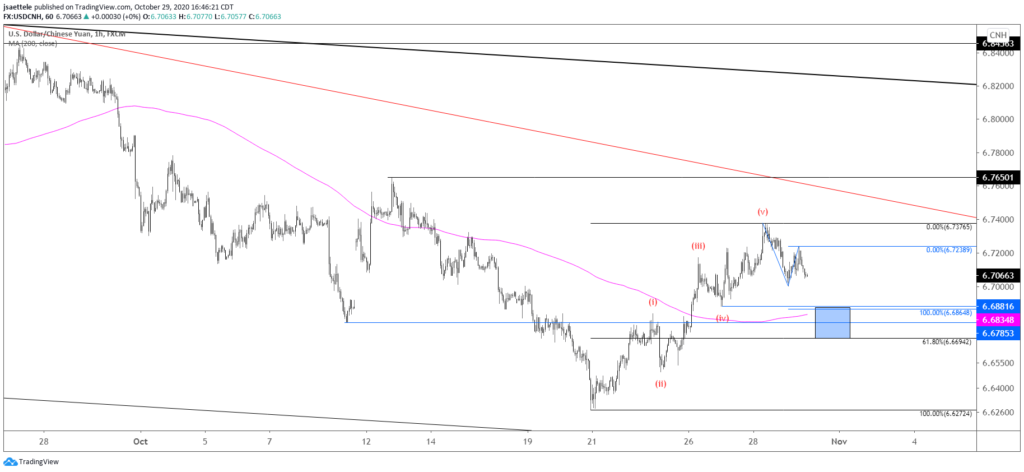
The USDCNH, DXY non-confirmation nailed the turn again. Upside is favored for the USD over the next few weeks but there are reasons to suspect that the USD pulls back slightly (so maybe a bounce in equities too). USDCNH pattern is one of those reasons. The rally from the low is in 5 waves so expectations are for a 3 wave pullback. That pullback is underway. The proposed support zone is 6.6690-6.6880.
October 27, 2020
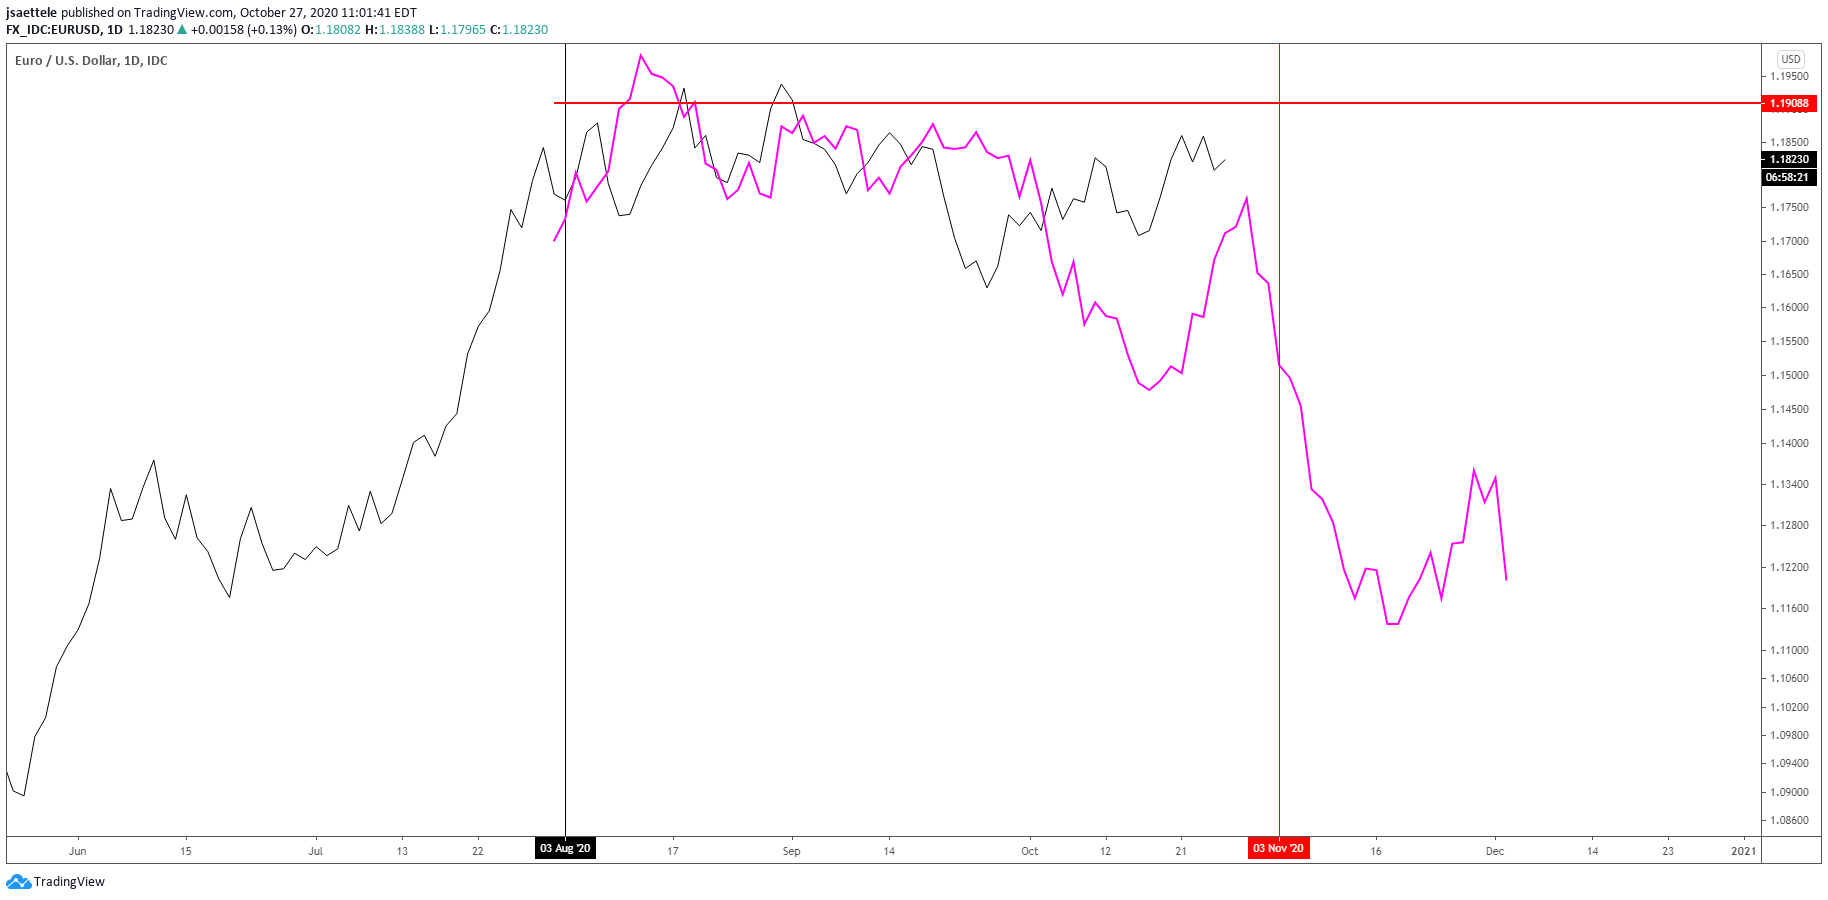
In case you haven’t heard, there are elections (president, congress, senate) in the U.S. next Tuesday, November 3rd. Do markets, notably the U.S. Dollar, tend to trade a certain way before and after U.S. presidential elections? In an attempt to answer this question, I plotted DXY in the 3 months leading up to and one month after every election since 1972 (blue for a Democratic win and Red for a Republican win). Each time series is compared to current DXY (in black). The vertical black line indicates election day. You’ll find these charts at the end of this report.
October 26, 2020
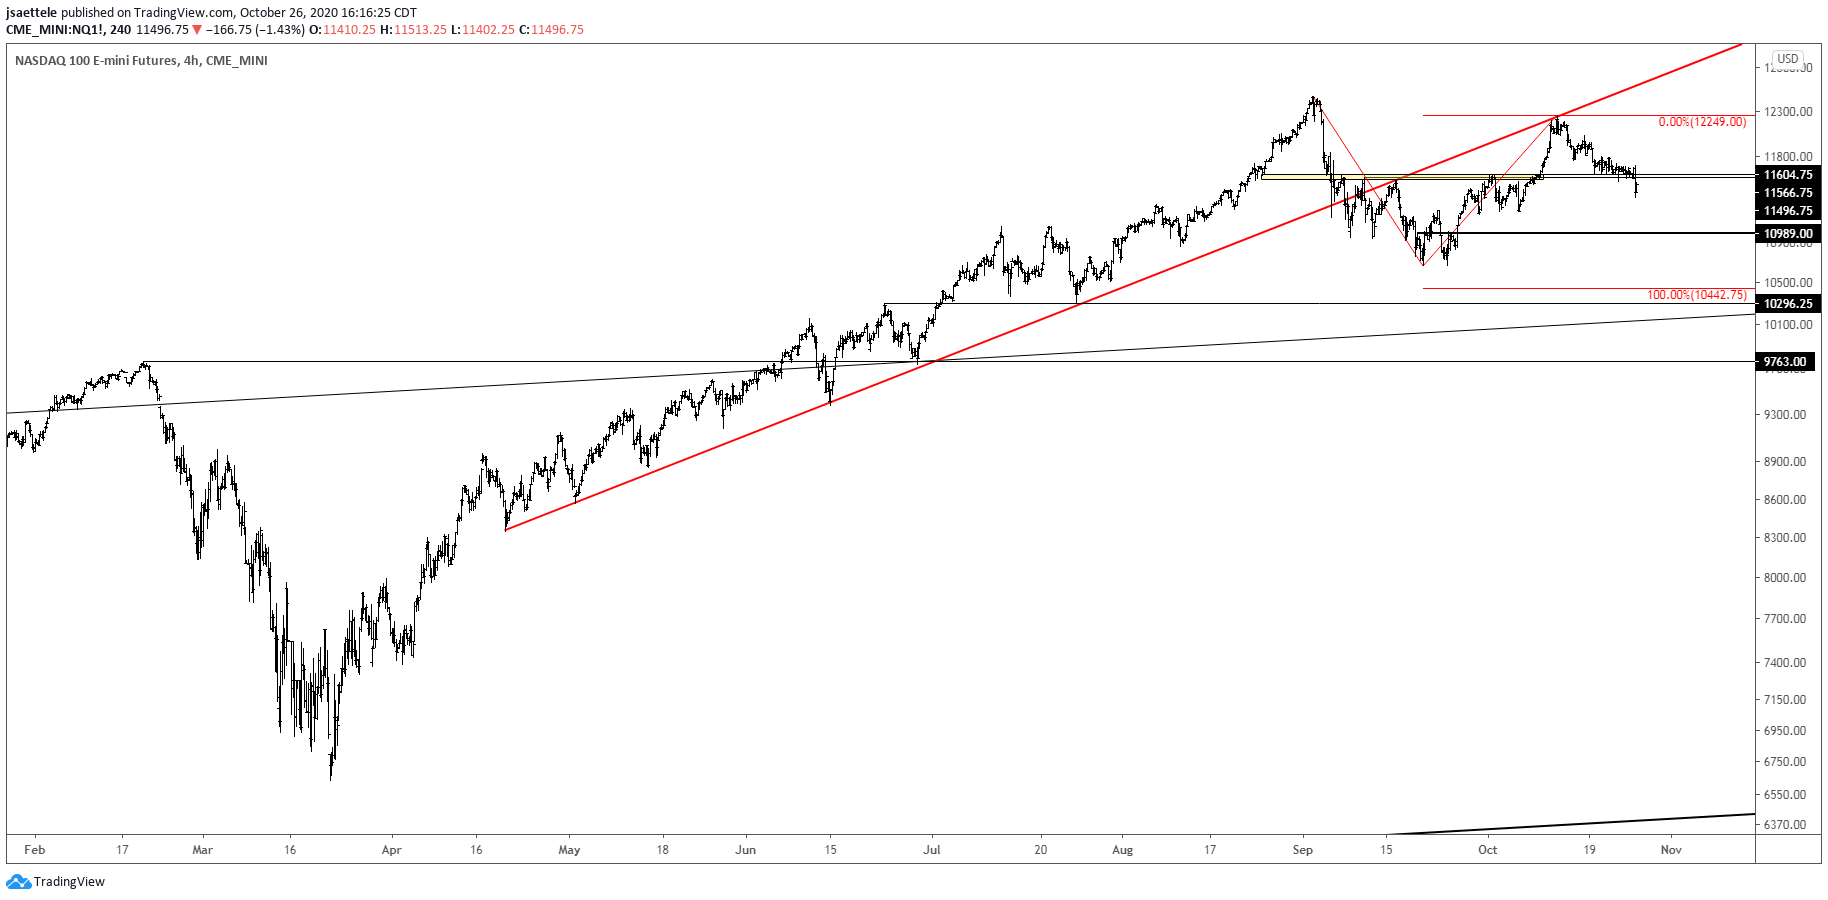
I’m treating the area around 11600 as near term bull/bear dividing line for Nasdaq futures. As long as price is below this level, I am looking lower. 10989 is a level to be aware of within the range with broader focus on 10300-10442. This is the 7/24 low and 2 equal legs down from the September high.
October 23, 2020

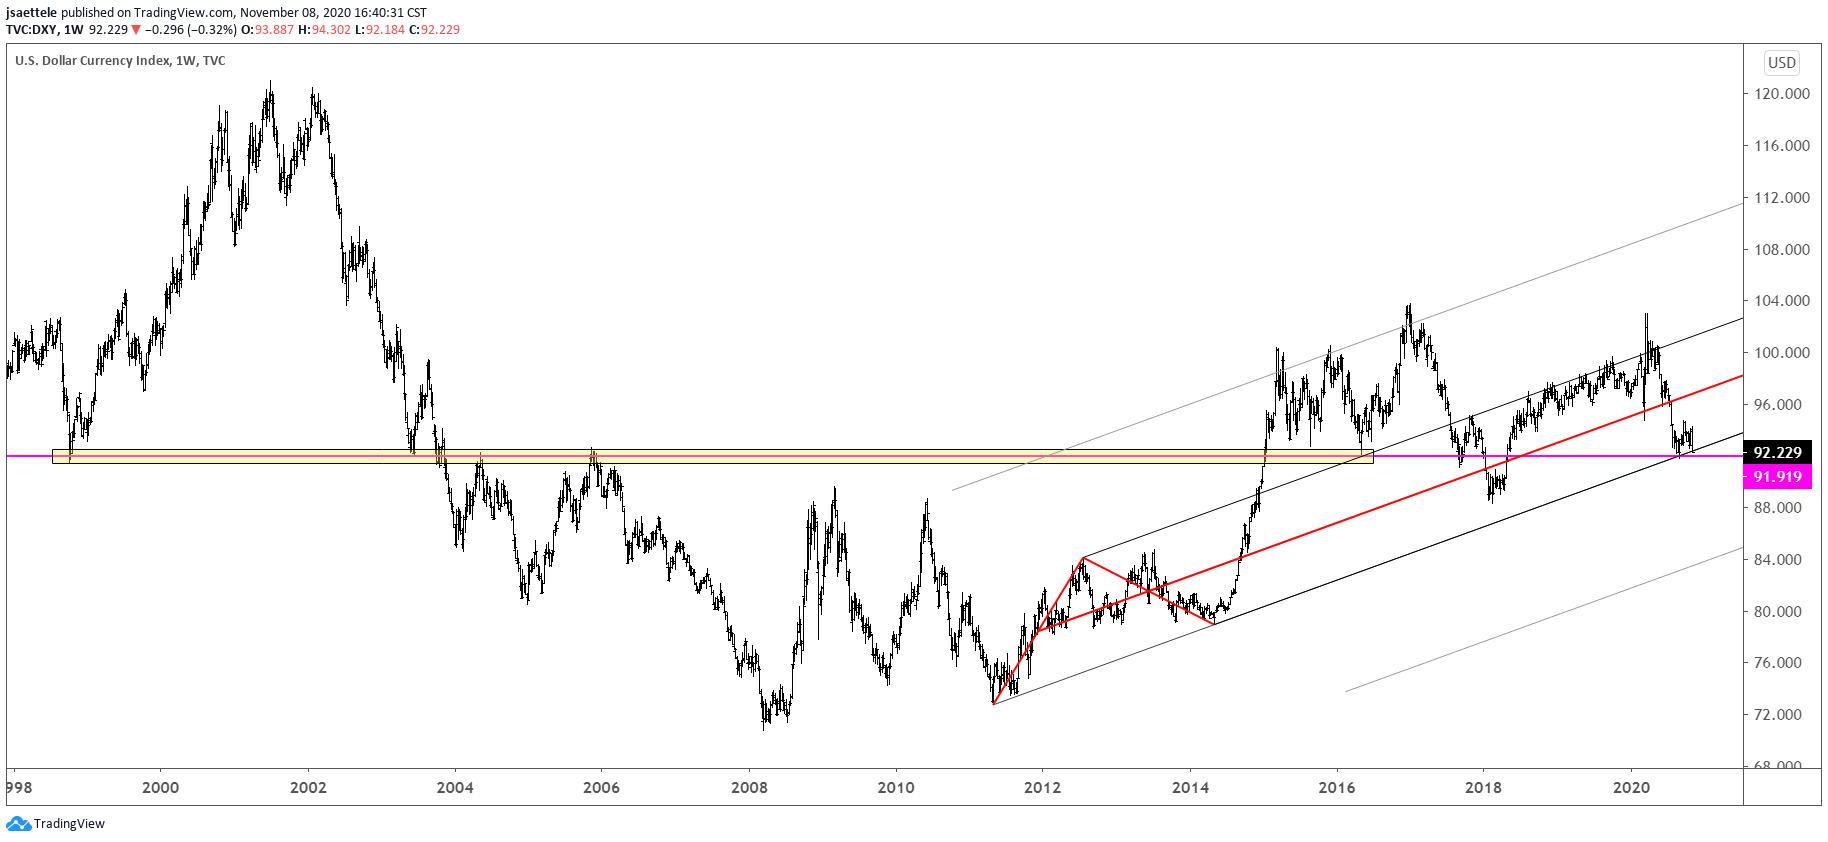
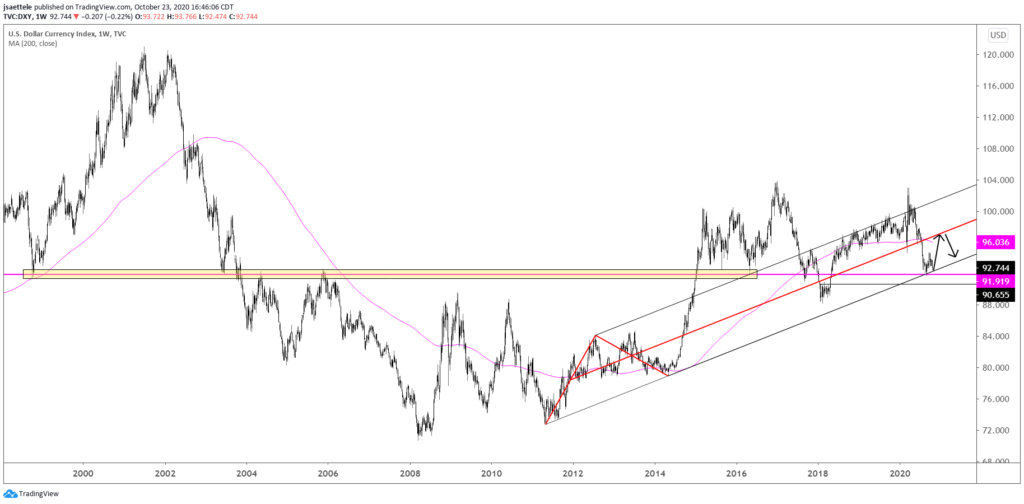
2011-2014 trendline support in DXY held in September. Focus is higher as long as price is above that level. 96-97 is a general zone to look towards. This zone includes the 200 week average and center line of the channel from the 2011 low.
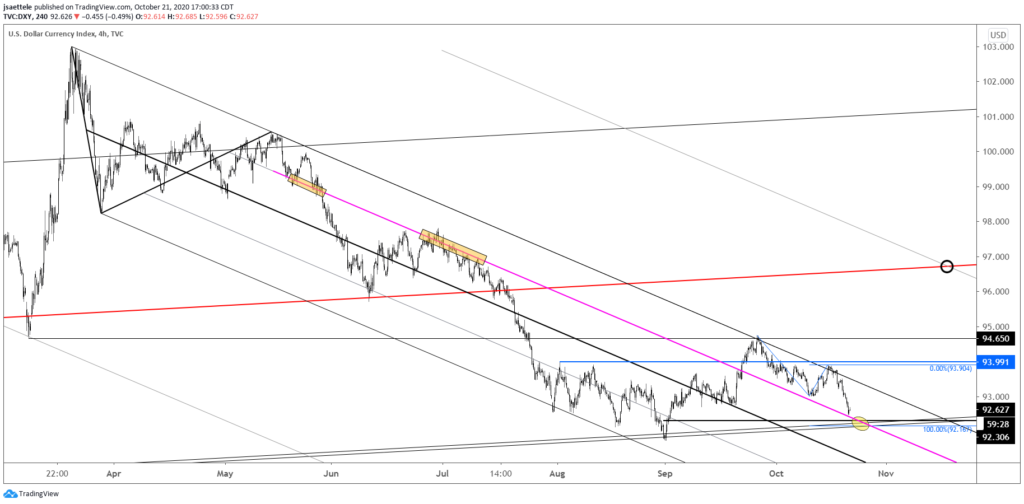
October 21, 2020

There is no change to DXY comments/opinion but I wanted to reproduce this chart because the index is nearing critical support at 92.17/30. The level is defined by long term trendline support (see longer term chart below), daily reversal support, and 2 legs down from the 9/25 high. This needs to hold if the range from late July is going to resolve to the upside.