Education
May 25, 2021

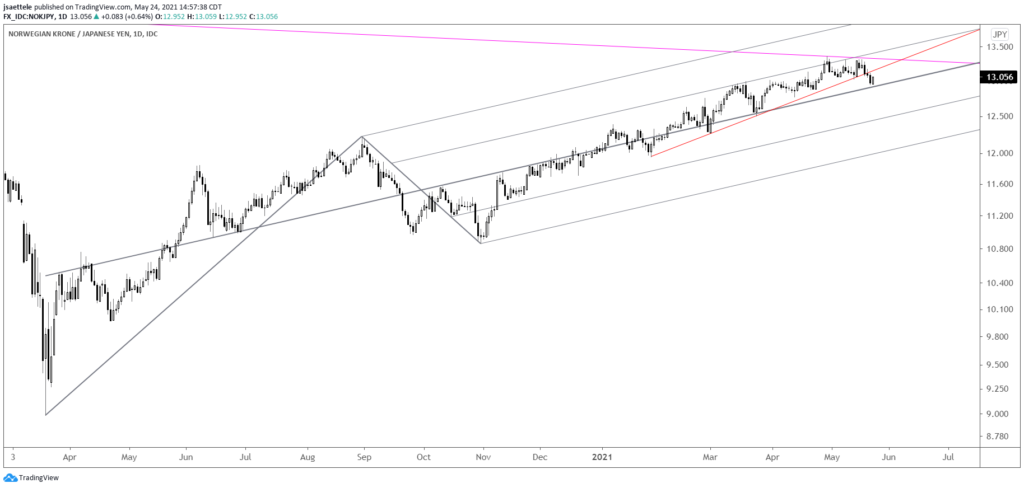
NOKJPY is an interesting chart. Price has rolled over from the trendline that connects the 2007 and 2013 highs. If a bigger down move is underway, then I’d expect resistance from the underside of the red trendline near 13.15. A longer term chart is below.
May 19, 2021

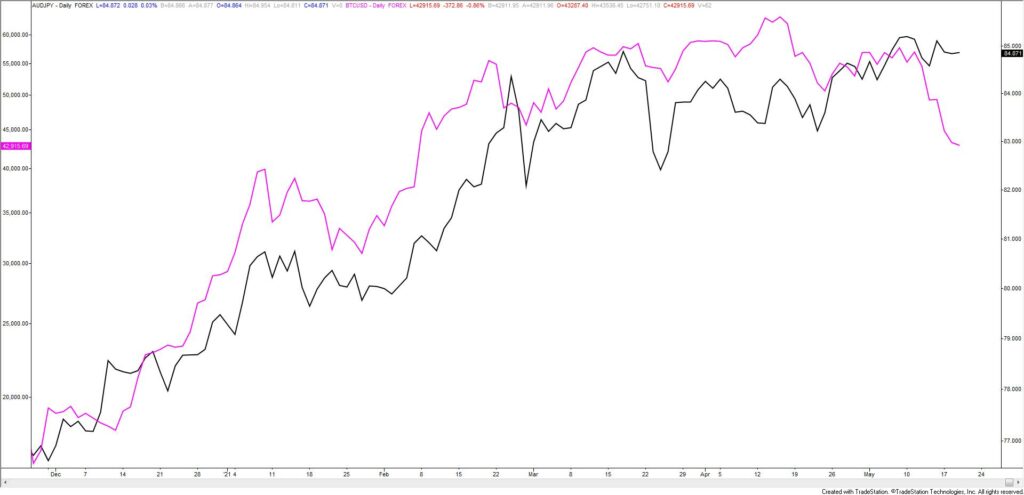
AUDJPY is in black and BTCUSD (bitcoin) is in magenta. My six year old son is standing behind me as a I type and just said ‘they look the same’. He’s right! We’ve been waiting for AUDJPY to tag the underside of the trendline from the 2008 low since February (AUDJPY is below). That line is currently about 86.50. I’d love a spike into that level to short but I’m not sure that happens with BTCUSD already breaking down. I’ll wait for 86.50 (or so) unless price breaks under the line that crosses lows since 4/23 (see magenta line on 4 hour chart below)
March 25, 2021
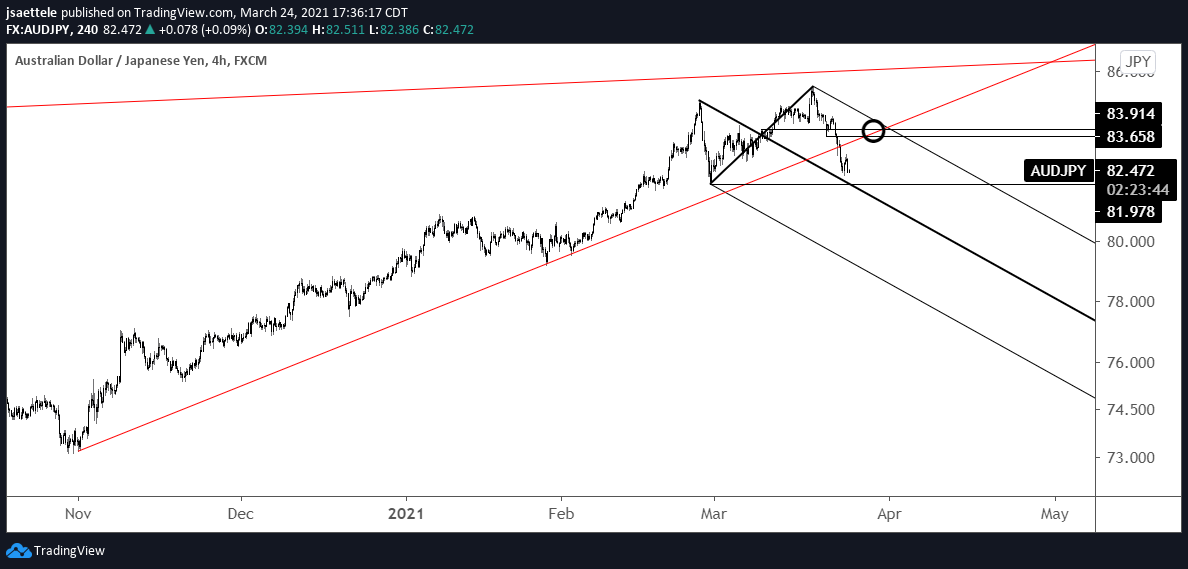
I love this AUDJPY short setup. Price has broken below the trendline from the November low. The underside of that line is now proposed resistance at 83.65/90. The 2/26 low is a bounce level at 81.98. Downside is the lower parallel from the bearish fork, which is significant (probably a 78 handle).
February 11, 2021

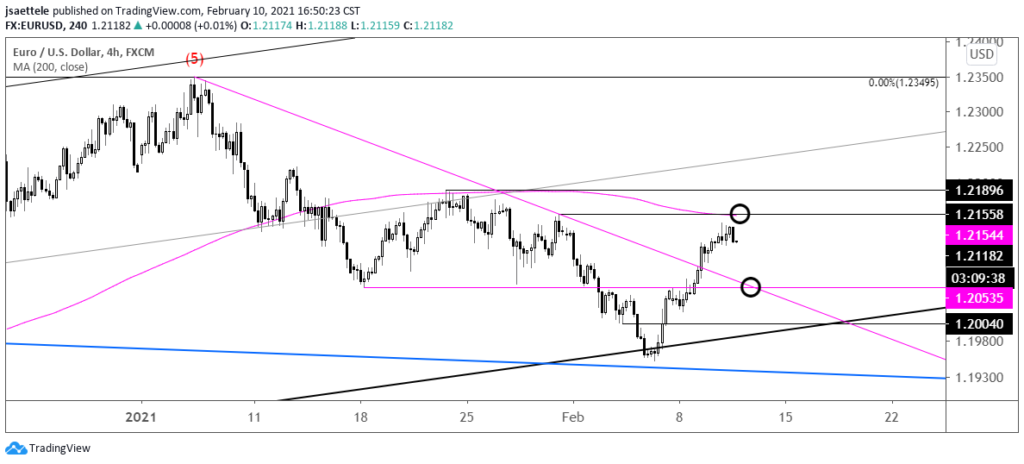
EURUSD traded in a very narrow range today and also made a doji (perfect doji…open and close are the same). Price tagged the month open too (1.2133). The 1/29 high and 50 day average are both 1.2155. Maybe we get a spike into that level before lower? I like leaving a short order at that level. 1.2050s may be support now.
December 23, 2020

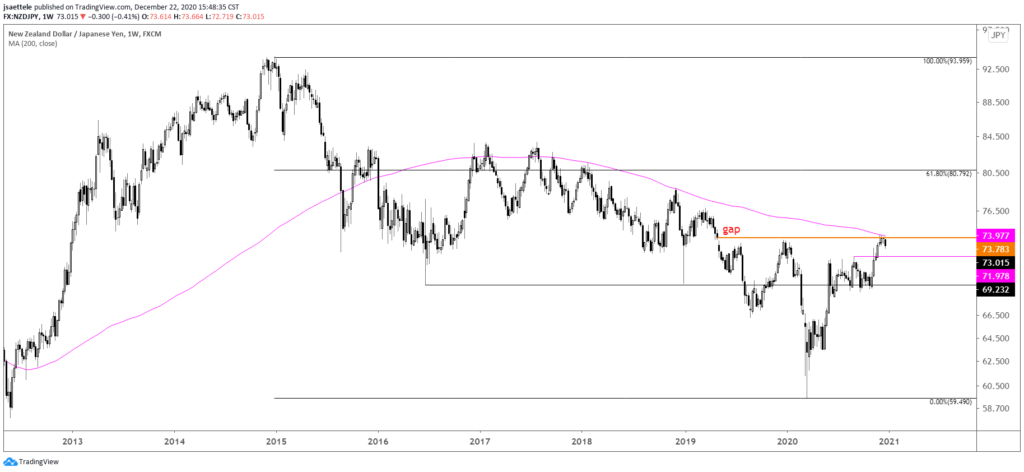
NZDJPY filled the previously uncovered close from May 2019 early this Month and is threatening to break down from a 4 week topping pattern now. The 200 week average has been resistance for years and is proving itself again at the current juncture. Near term focus is on former resistance at 72.00 with a much deeper drop (69.00ish) from the current level possible given the specter of 5 waves up from the March low.
November 16, 2020

USDCNH made a weekly J Spike last week (price based only indicator). The platform that I use to run these studies only includes USDCNH data since 2013 and this is the first bullish signal. There have been several bearish signals; at the 2018 and 2019 highs. A turn higher in USDCNH ‘fits’ with a turn lower in Chinese equities.
October 14, 2020

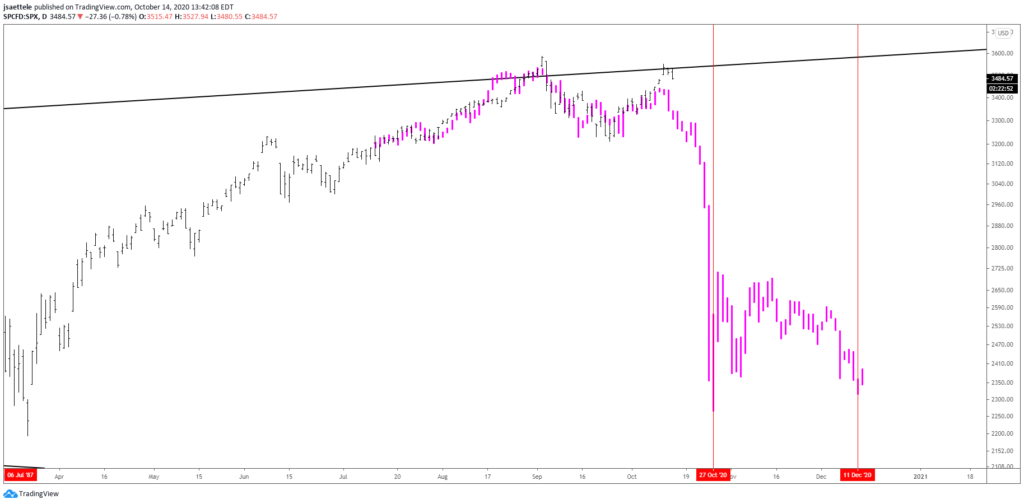
The top 3 month EidoSearch is the 3 months leading up to the 1987 crash. This is not a prediction, simply an observation. Getting back to reality, 3428/55 is an important short term zone. The top of this zone is channel support. Weakness below would warrant a bearish position…then see what happens.
May 7, 2020
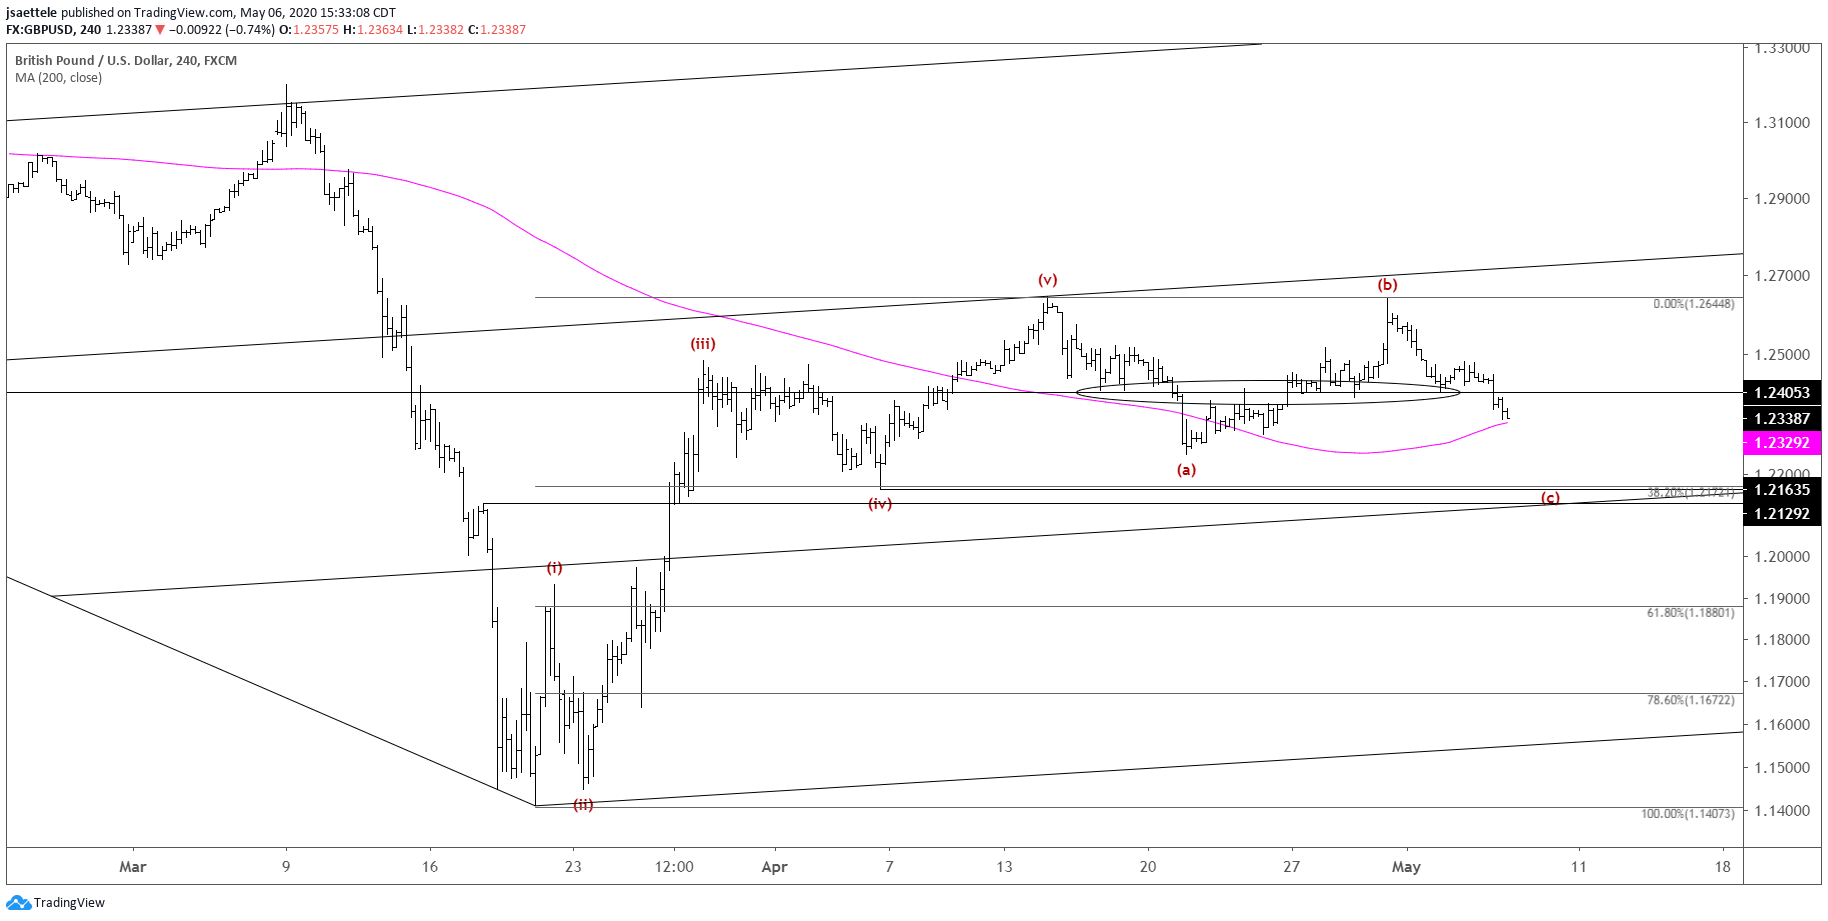
BoE is tomorrow and it looks like the bounce to 1.2484 is the extent of the corrective bounce in wave 2 of C. Proposed resistance is now 1.2405/20, which is a well-defined horizontal level and the neckline of a short term head and shoulders.