Education
May 7, 2020
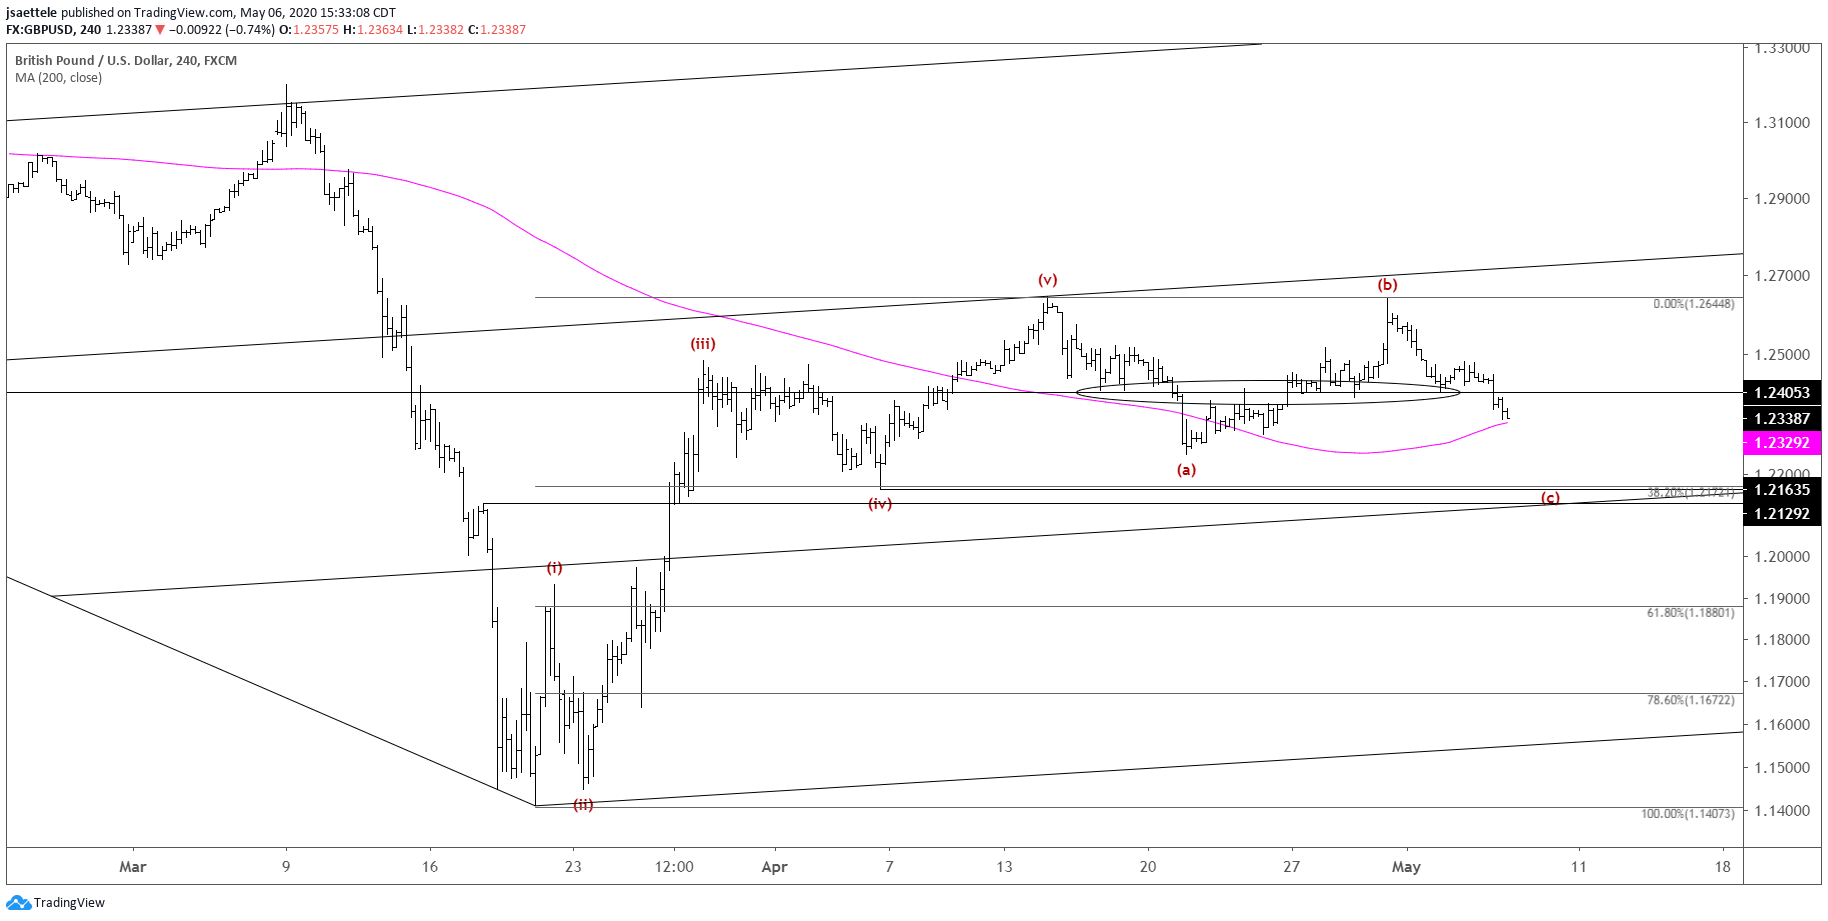
BoE is tomorrow and it looks like the bounce to 1.2484 is the extent of the corrective bounce in wave 2 of C. Proposed resistance is now 1.2405/20, which is a well-defined horizontal level and the neckline of a short term head and shoulders.
May 5, 2020

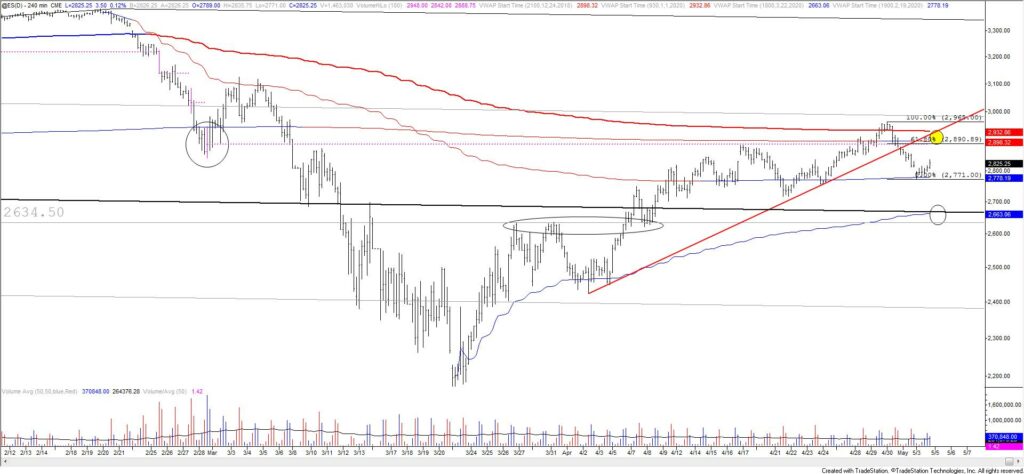
ES found support today from VWAP off of the Feb high. This level was resistance in March and support in April. I am treating last week’s high as the bearish risk point but given the support hit today a bigger bounce is favored. Resistance should be 2890-2930.
May 4, 2020

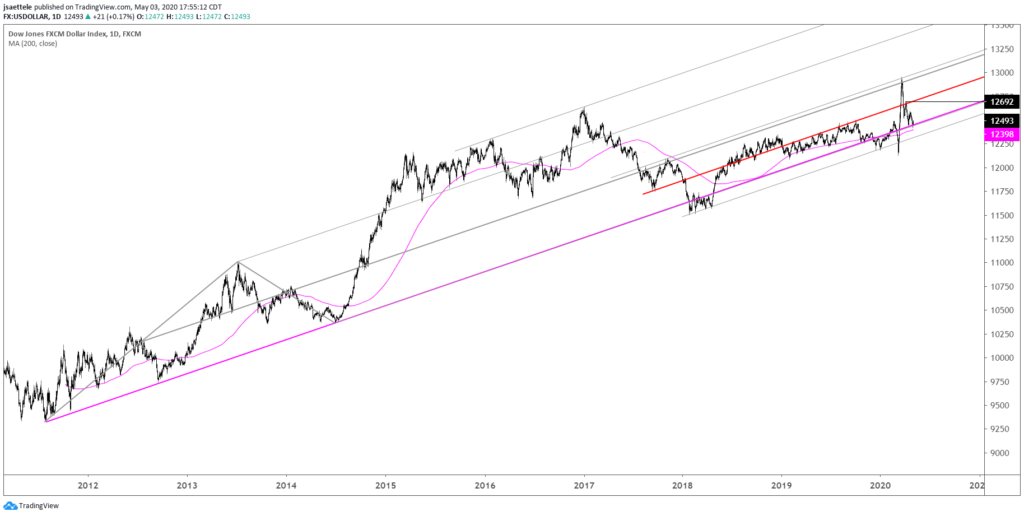
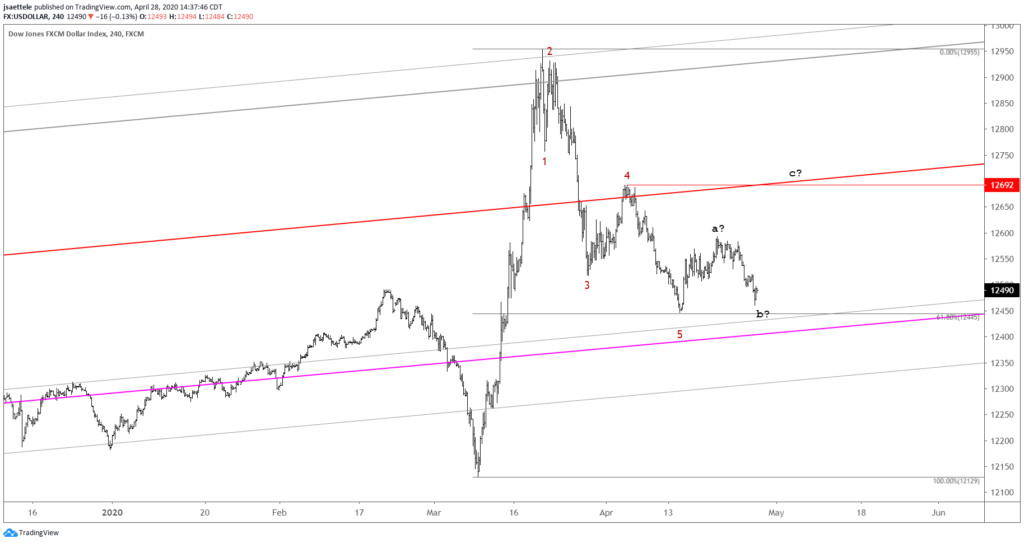
A flat is still possible. Thursday’s low would compose wave B. If this interpretation is correct then wave C should carry above 12593. The most likely spot for resistance remains the wave 4 and red parallel at 12692. Bottom line, USDOLLAR reacted at critical support (l0ng term magenta trendline) so focus is higher as long as price is above last week’s low.
April 29, 2020

To review, USDOLLAR dropped in 5 waves from the March high. The 4/14 low was right on the 61.8% retrace of the rally from the March low. At that point, I was looking for a 3 wave rally back to 12692. Instead, USDOLLAR has traded in a tight range. Price is nearing the 4/14 low. It’s not impossible that the rally into the 4/21 high at 12593 is the entire correction but the correction would be awfully small in both time and price retracement. So, it’s possible that a flat is unfolding. Under this scenario, a C wave rally (probably sharp) will begin from nearby levels (may or may not take out the 4/14 first).
April 28, 2020

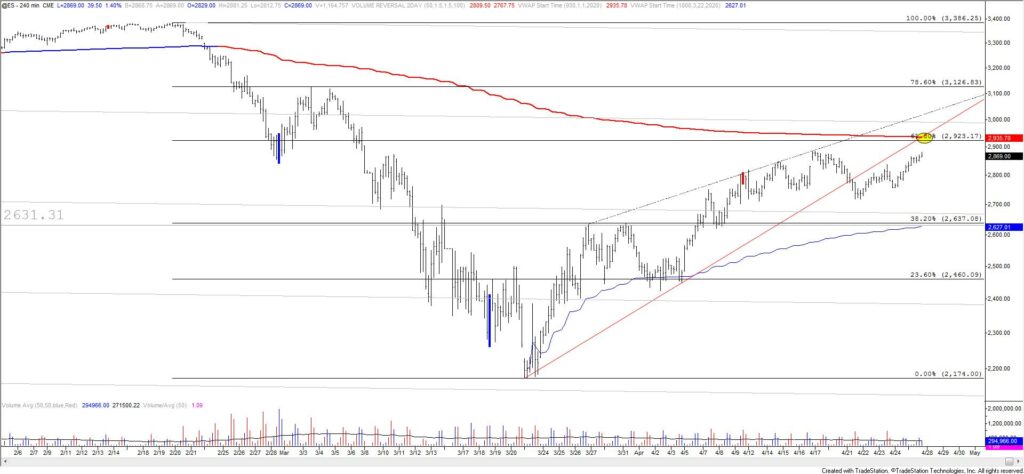
‘The market’ continues to levitate. Each turn lower from a well-defined level (the most recent turn lower was from where the rally from the March low consisted of 2 equal legs) is met with another leg up. Volume has died, as is tends to do when markets rally. From here, I am paying attention to 2 levels for potential resistance. The first is 2923/35 in ES. This is the 61.8% retrace and 2020 VWAP. In cash (chart is below), the 61.8% retrace is 2935. The 2nd level to note is the 200 day average and July 2019 high on cash, which is 3007/28.
April 24, 2020

Jamie looks at the 5 wave rally into the April high in GBP/USD.
April 22, 2020
Cable staged a modest rebound in early trading on Wednesday, after falling to a two week low on Tuesday. The US dollar was broadly boosted by […]
April 22, 2020
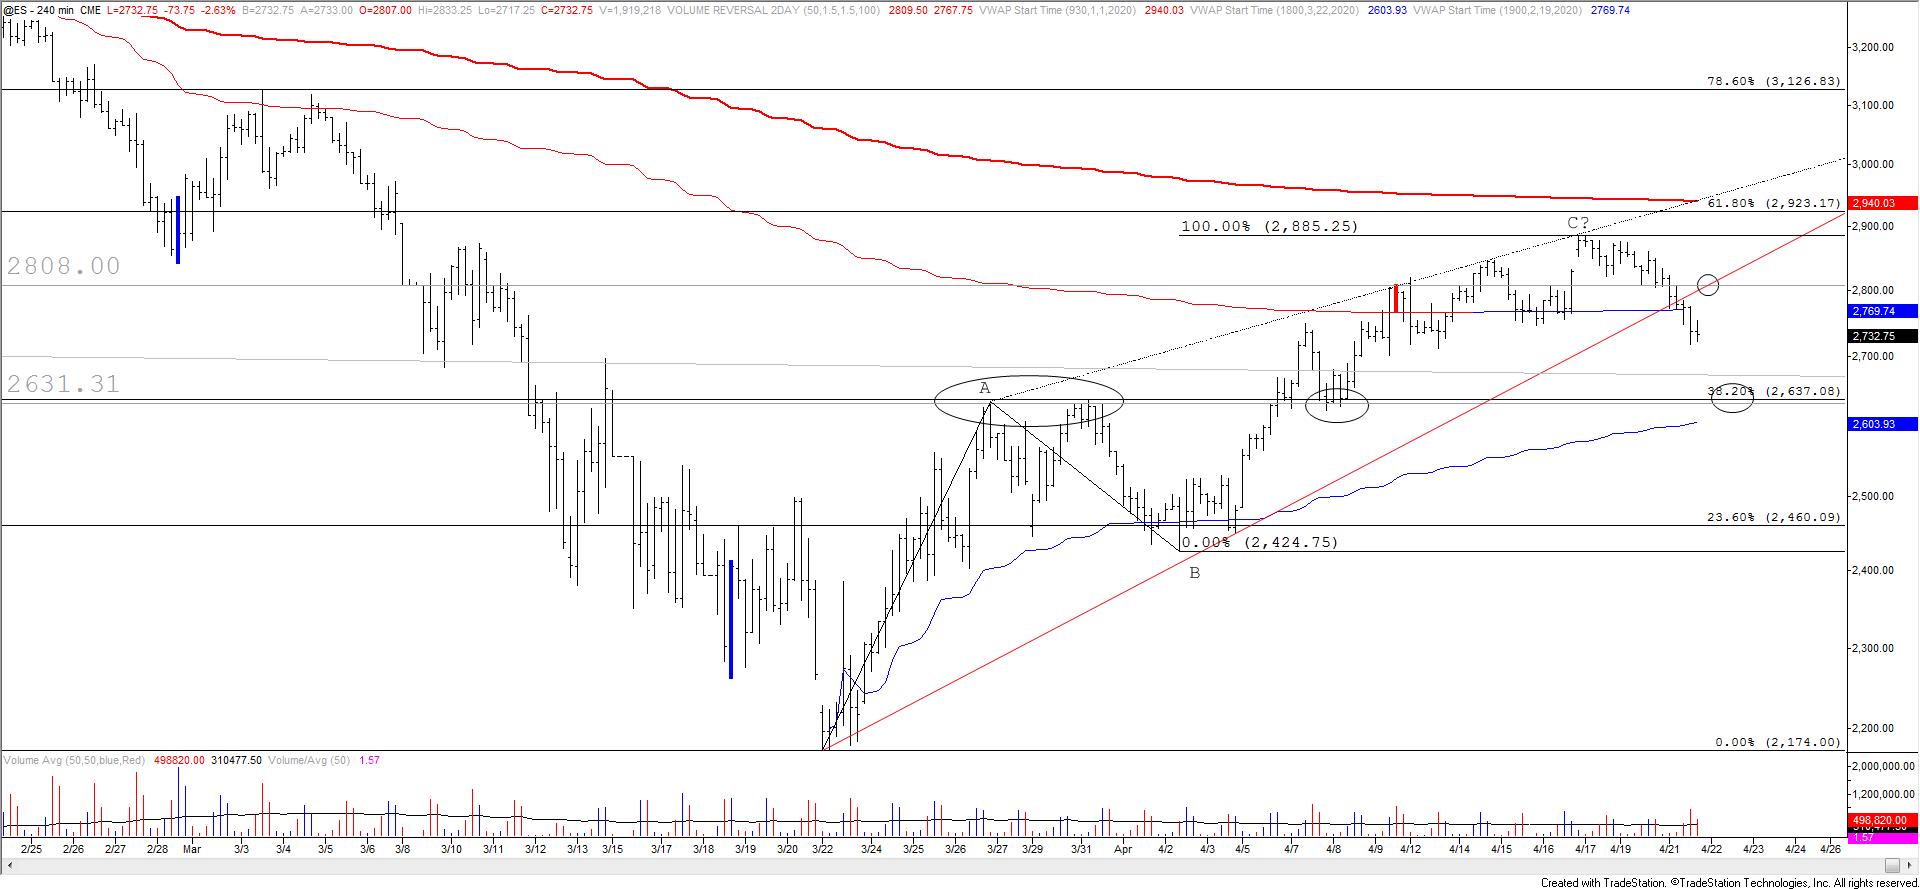
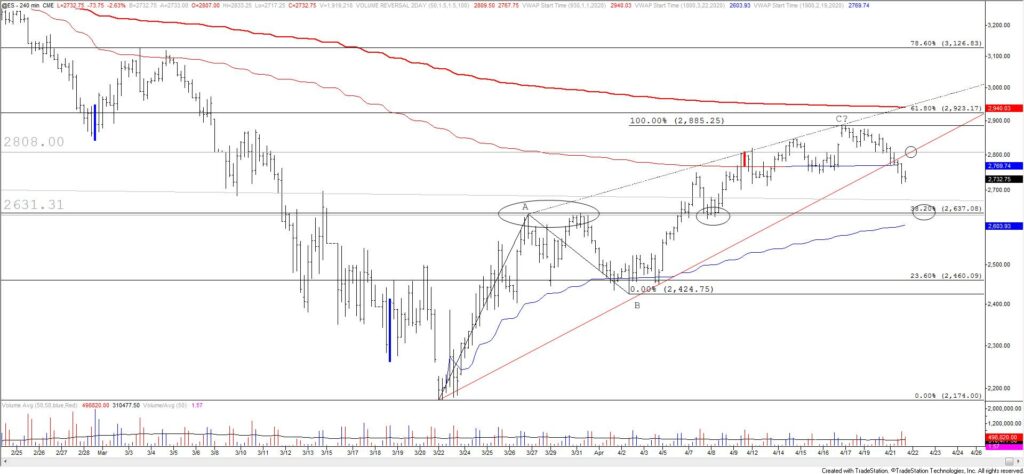
Today’s ES break confirms the rally from the March low as a wedge. The implication is that the March low will eventually be re-tested. Near term, I’d still watch for a bounce from 2600/30. Proposed resistance is now the underside of the broken wedge line at 2808.
April 21, 2020

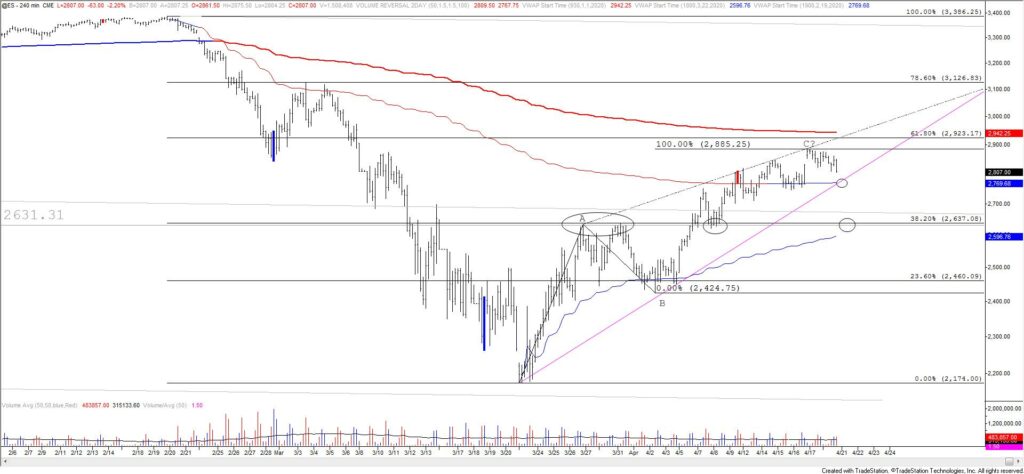
Remember the 4 hour volume reversal on 4/9? ES failed to follow through on that reversal but price is back to that level. 2923/48 wasn’t reached but the rally from the March low consist of 2 equal waves…exactly. So, there is reason to ‘think’ that a countertrend rally is complete. Pay attention to 2770, which is the trendline from the low and VWAP from the February high. A break below there would also leave the rally from March as a bearish wedge, which would suggest an eventual re-test of the low. The next immediate spot to watch then would be 2600/30 (VWAP from the low and recent resistance and support).