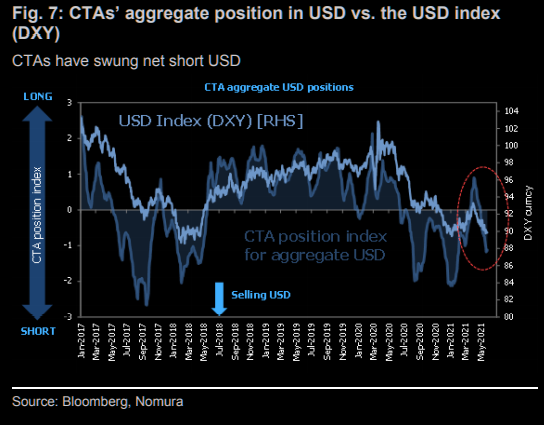
Market Update 5/25 – CTAs Chasing USD Shorts Again
Not surprisingly, CTAs are chasing USD shorts again. Of course, this tends to happen just before a turn (then they chase the USD higher).
Not surprisingly, CTAs are chasing USD shorts again. Of course, this tends to happen just before a turn (then they chase the USD higher).

Since the 5/10 high, AUDUSD has dropped in 5 waves, rallied in 3 waves, and dropped in 5 waves at a lesser degree. An Elliott wave textbook! Resistance should be .7760/70 now. Broader downside focus is .7415 (2 legs down from the February high and the September high…see below). 5/18 – AUDUSD tagged .7814 today. Again, this is the 61.8% retrace of the decline from 5/10 and well-defined resistance since early January. This is a great spot for AUDUSD to roll over. .7730 needs to give in order to ‘open the floodgates’. This level is 2021 VWAP, VWAP from the February high, and VWAP from the March low (see futures chart below).
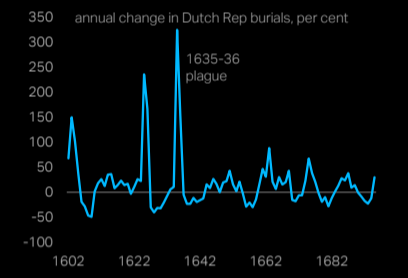
The Dutch Tulip bubble also occurred during a pandemic. One popular narrative for tulip price behavior blames excitable Dutch merchants who had nothing better to do than sit around in taverns bidding up the price of exotic flowers (global trade was effectively in “lockdown” then)…sound familiar?
BTCUSD closed right at the noted 44000 level today. Big spot! I lean towards the downside following completion of the massive top that has been forming since February. The next downside level of interest is 32000 (or so).

A print under 11745 in USDOLLAR will complete 3 waves down from the 5/3 high and give way to another leg up…at least that’s what I’m thinking. Reminder, NFP is tomorrow!

Kiwi has traded in a textbook fashion over the last week or so. Resistance at the channel high…hard break of the center line…center line acting as resistance…and finally the lower channel line holding.

DXY turned sharply higher on Friday but gave back a good portion of those gains today. The rally counts in 5 waves (impulsive) which suggests at least one more leg up while price remains above Friday’s high. 90.79 is proposed support if price slips a bit lower.

TLT completed a 2 bar monthly volume reversal in April. This is the 3rd bullish monthly signal ever. The first 2 (blue bars) nailed lows in August 2003 and July 2007.

EURJPY closed right at 132.00 today. This is HUGE. The level is defined by the underside of the trendline from the 2012 low and the trendline from the 2008 high! If you look at a 4 hour chart, you’ll see a 4 hour reversal candle. This occurred during the active U.S. session so perhaps a top is in place? The big short trigger remains a break of the upward sloping trendline but if price drops in a clear 5 waves from today’s high then I’ll plot an entry. Stay tuned.

USDJPY did indeed pull back from 109.00. My near term view is that the drop is a 4th wave within a 5 wave rally from the 4/23 low. Ideal is support is 108.52/55. This is the 38.2% retrace of proposed wave 3 and the 4/20 high.