Major Levels in USD Crosses and Silver
Scand.Ex is pleased to present the next video with trading analysis by Jamie Saettele, our Chief Technical Analyst.

Scand.Ex is pleased to present the next video with trading analysis by Jamie Saettele, our Chief Technical Analyst.

Today was the first day since the rally off of the March low that QQQ made a lower pivot high with 5 day strength. That means that there are 5 days on each side of the high.

So much for ‘extreme sentiment’ towards the USD. DXY dropped for a 7th straight day today. Price is now testing the trendline from the 2011 low. The lower parallel from the channel off of the March high is slightly lower…about 93.15 (see below). At this point, I’m not sure where the next level of interest is if DXY fails to hold.

USDOLLAR (EUR, GBP, AUD, and JPY) is testing a major level (daily chart is below). Price reacted today at the top side of the center line of the Schiff fork from the March high and the top side of the line off of the March and May highs. This is a great spot for a bounce. Pay attention to the upper parallel and former support at 12253. A break above there would indicate an important behavior change.

THE U.S. DOLLAR IS GETTING PUNCHED IN THE MOUTH, AND ITS OUTLOOK AMID CORONAVIRUS DOESN’T LOOK GREAT, SOME EXPERTS SAY
Scand.Ex is pleased to present the next video with trading analysis by Jamie Saettele, our Chief Technical Analyst.
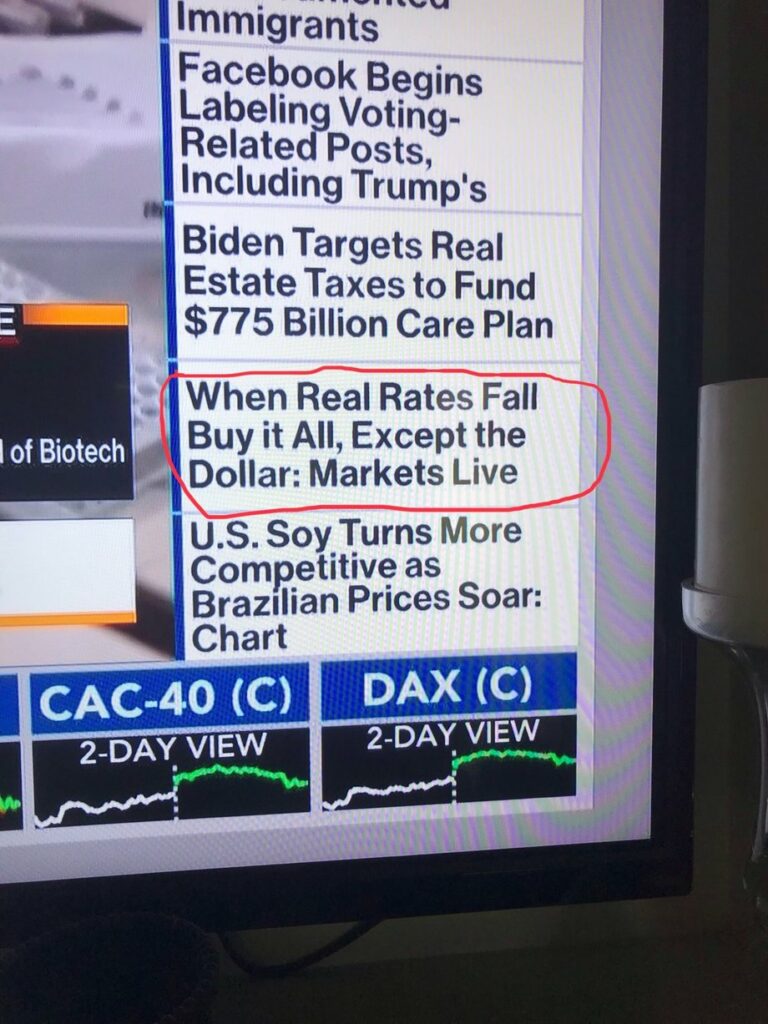
This is a picture of the TV in my living room earlier today. I keep Bloomberg on throughout the day for background noise and the scrolling headlines on the right of the screen are the same headlines that are published on the app. The headline circled in red would not appear if the short USD trade weren’t extremely crowded, at least on a short term basis. Sentiment is ripe for a reversal.

I’m not sure what to say anymore when it comes to indices. NYSE breadth, for example, was negative today (more stocks down than up) but both the S&P 500 and Nasdaq were up. The Nasdaq was up A LOT thanks to MSFT and AMZN.

Seasonal tendencies are now bullish-sideways for DXY (and bearish-sideways for EURUSD) through mid-August. The biggest shift in seasonal tendencies however is in the commodity currency complex. AUDUSD and NZDUSD enter their most bearish period of the year starting now. USDCAD is in its most bullish period of the year. Nasdaq seasonal tendencies are bearish through August 14th. These charts are shown below.