Education
September 2, 2020
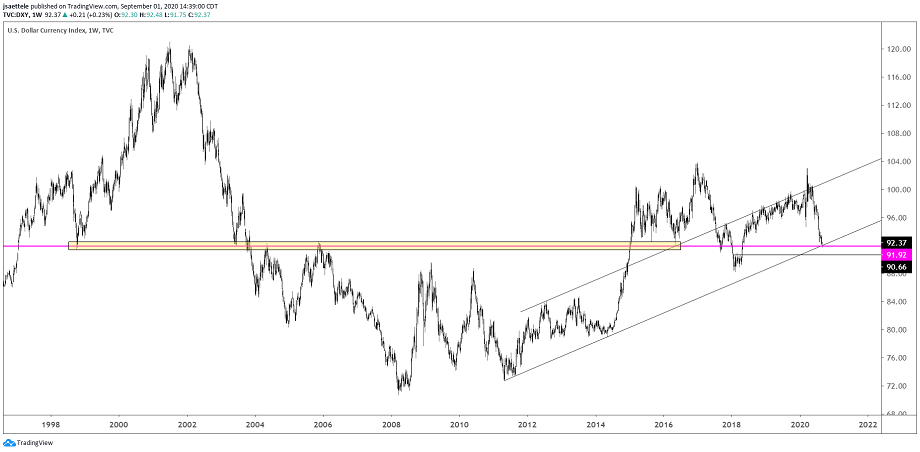
DXY traded 91.75 today before turning (exact midpoint between 91.50 and 92.00 by the way) higher. A daily volume reversal triggered in the process! We now have 2 triggers since 7/31, which is similar to the 2 triggers in January 2018 and summer 2018. Additional signals occurred in May 2016 and May 2014 (these are all circled on the chart below). Strength above 93.04 (high volume level from Powell’s Jackson Hole speech last Thursday) would break a 1 month wedge and suggest that the trend has reversed (hourly chart is below too).
September 1, 2020
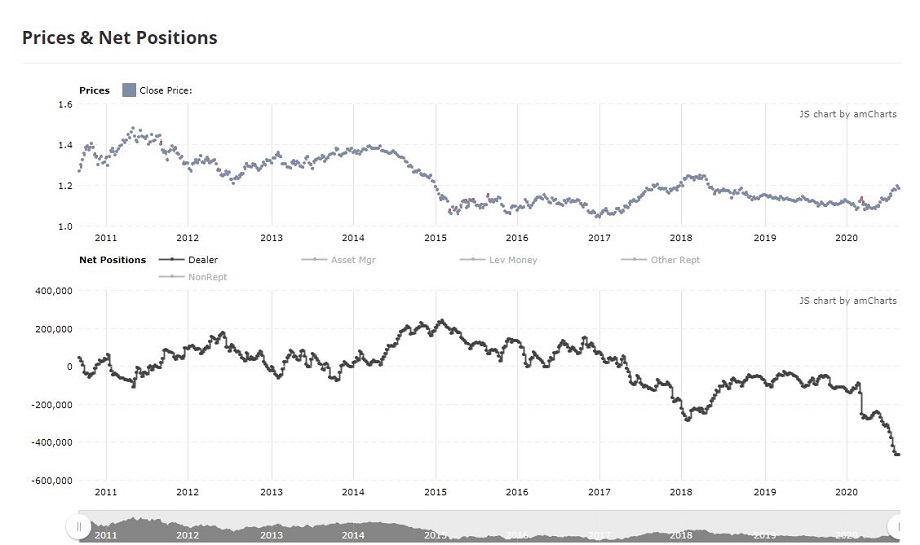
In financial futures, dealers are considered the ‘smart money’. They tend to be bearish at the top and bullish at the bottom. So, it usually pays to pay attention when their position becomes extreme. Well, the dealer short position in Euro is basically off of the bottom of the screen. In fact, the dealer short position in early 2018 (last big EURUSD high) pales in comparison to the current position. Price wise, pay attention to the levels noted yesterday.
August 31, 2020
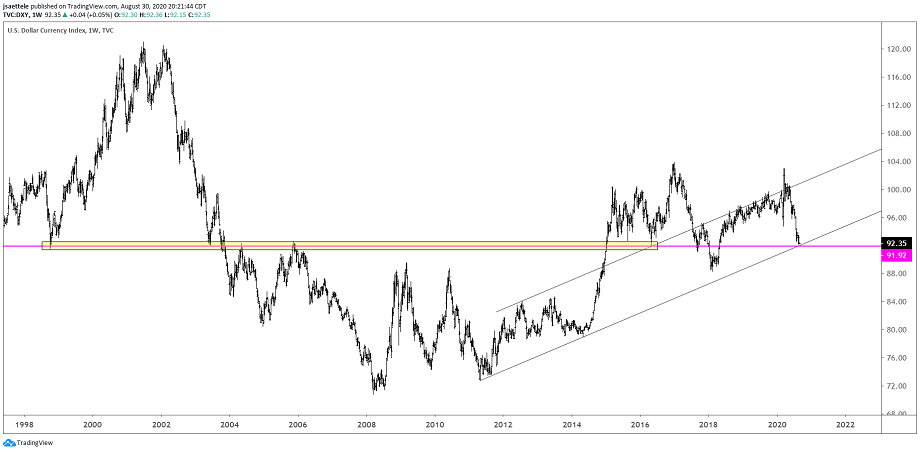
Is DXY still ‘trying’ to bottom? If so, then it needs to turn up around 92, which is the line off of the 2011 and 2014 lows (arithmetic scale). 91.50-92.00 has also been a major pivot since 1998. I sound like the boy who cried wolf but I’m on alert for a turn higher.
August 28, 2020

Gold is sitting on top of the 2011 high…major level. A break below would open up 1765/90 (see hourly chart below), which is a well-defined zone and intersects the lower parallel of the Schiff fork from the high. Proposed resistance is 1941 (high volume level from today). As noted yesterday, I’ve been tracking near term fluctuations in GLD. High today was just above 185, which keeps the short term bearish channel intact (see yesterday’s GLD chart).
August 27, 2020
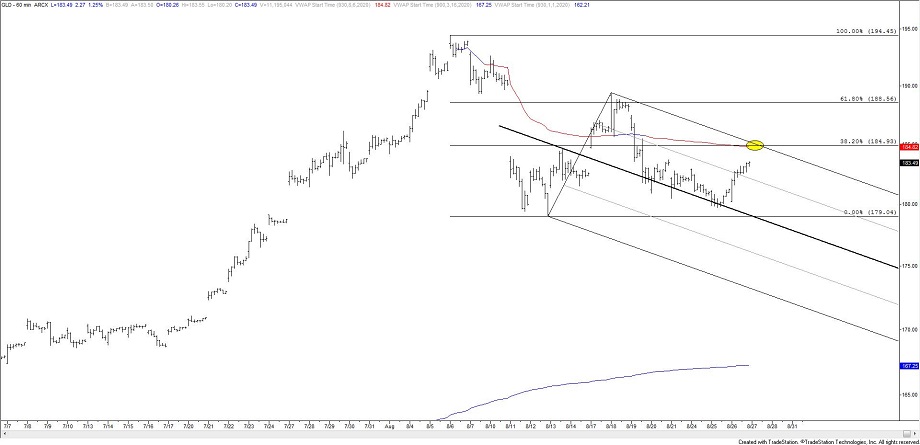
Since the 8/6 high in gold, I’ve been closely tracking GLD. The rally from 8/12 found resistance at the 61.8% retrace and a short term bearish channel is confirmed following the median line touch. If GLD has turned lower, then resistance should be 185.00 (38.2% retrace and VWAP from the high).
August 26, 2020

These 3 charts are from Nordea’s latest FX Weekly. The relationships between the Fed’s balance sheet / USD, Trump’s job approval / USD, and EURUSD / US-Europe Covid case count spread all point to a stronger USD from current levels.
August 25, 2020
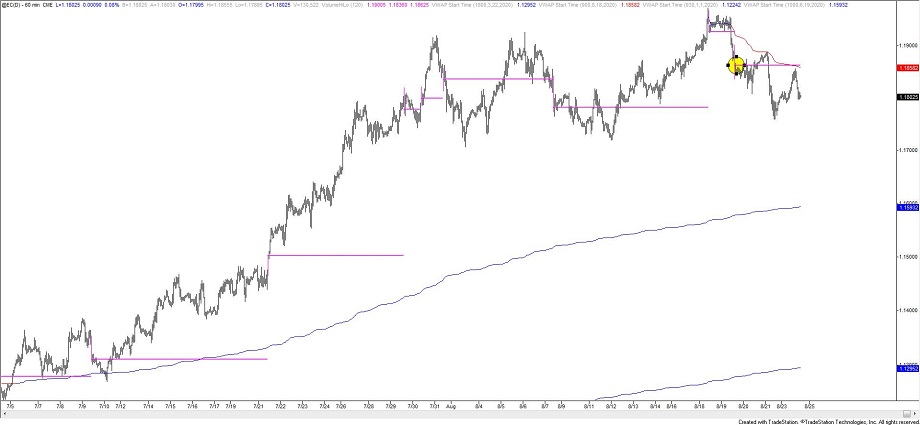
3 lower highs and 2 lower lows since the EURUSD high. I like that strength has failed near VWAP from the high twice and that today’s high is near the high volume level (circled) from 8/19. 1.1880 is still resistance if reached and the big test for the bulls remains the lower parallel, currently near 1.1675 (see below).
August 21, 2020
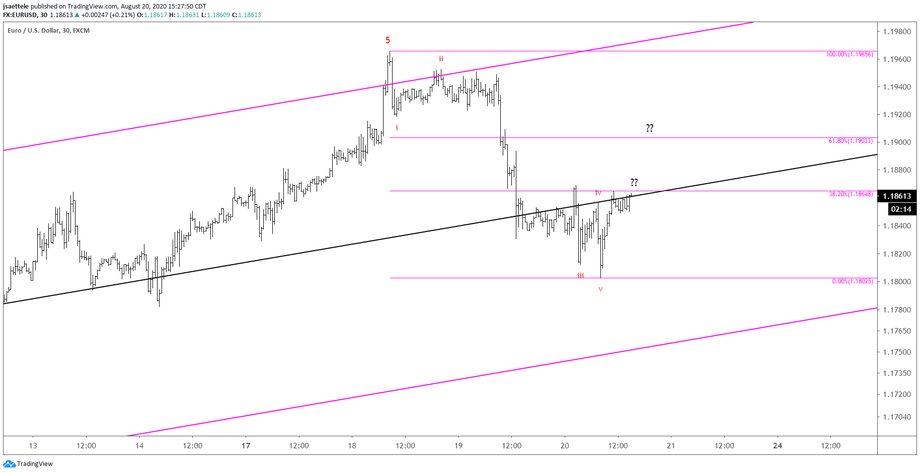
The EURUSD drop from Tuesday’s high is in 5 waves and price has retraced 38.2% of the decline so weakness could resume now. If that fails to materialize, then the 61.8% is proposed resistance at 1.1903.
August 20, 2020
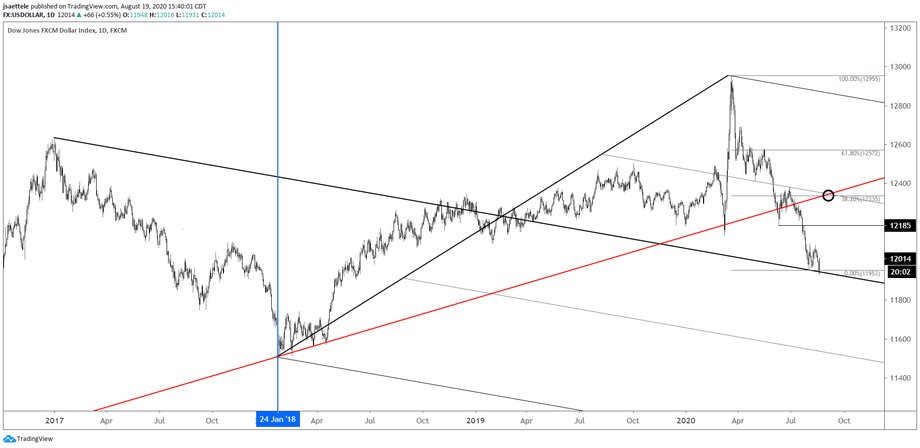
USDOLLAR dipped under the 8/2 low today and reversed sharply. Today was a bullish outside day, just like 8/2 (close up chart below). I view today as a re-test / fake-out and still favor upside with the previously mentioned 12350 or so as ‘swing’ upside to target. Near term, the March low at 12129 is a possible reaction level.