Market Update – July 21
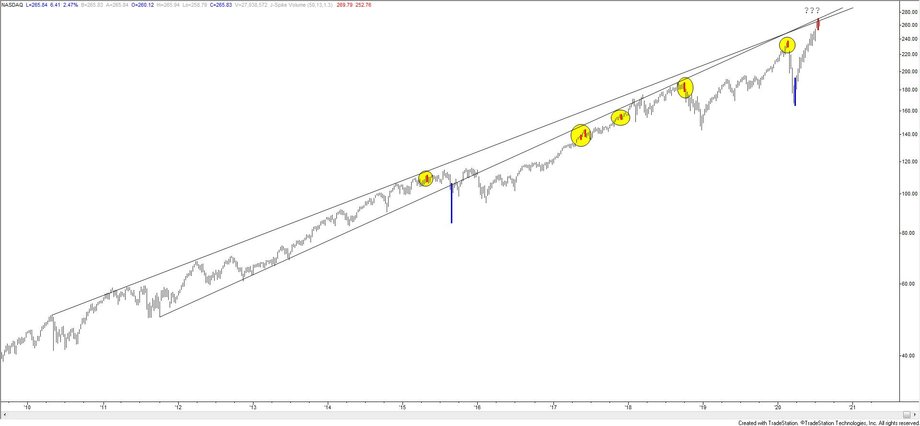
QQQ WEEKLY
I’m not sure what to say anymore when it comes to indices. NYSE breadth, for example, was negative today (more stocks down than up) but both the S&P 500 and Nasdaq were up. The Nasdaq was up A LOT thanks to MSFT and AMZN. In fact, AMZN accounted for 263% of the S&P 500 gain today. I guess nothing matters expect for the movements of the few companies with 1.5 trillion+ market caps but I’ll share the following observation anyway. QQQ made a volume reversal last week. The last 2 bearish ones nailed tops (no good before that though) and the bullish ones worked as well. I also view this area as important based on a long term trendline confluence. That means that this is a good place for something besides ‘up’ to happen.
EURO FUTURES 8 HOUR

EURUSD is still at a level that I view as resistance (daily spot chart shown below). An 8 hour volume reversal triggered today too. There was one at the early June high and one at the September 2018 high. Risk is lower here in my opinion but I’ve thought that for the last week. A high volume level up here would at least establish a point of reference to trade from. I don’t have a setup for entry at the moment.
7/16 – The ‘about face’ in USD action today strongly suggests that we’re on the right track insofar as being near term USD bulls. Regarding EURUSD specifically, the 5 wave rally from the 4/24 low is ‘textbook’ so expectations are for at least a corrective pullback. The year open at 1.1260 along with parallels just below are likely initial support for a bounce.
EURUSD DAILY

USDJPY 4 HOUR

USDJPY continues to hold up and there is no change to the 107.70 initial target with potential for 108.70s. Risk on longs is now breakeven (107.00). Be aware of a high volume level now at 107.39 (from Monday’s Asian session). If that price is taken out then I’d pay attention to it for support.
7/16 – No change to near term USDJPY analysis. Focus remains on the 25 line near 107.70 and the upper parallel, which intersects where the rally from the June low would consist of 2 equal legs at 108.76. Note that the year open for USDJPY is 108.75! Bottom line, 108.70s is significant.
GBPUSD HOURLY

GBPUSD looks great and support should be 1.2625 now on its way to the June high at 1.2814 and possibly the longer term median line near 1.2960. What ‘annoys’ me is the extreme sentiment towards the USD generally (a lot of bears out there…DXY speculative shorts are the highest in over 7 years). It’s possible though that GBPUSD holds up and EURUSD doesn’t (Euro is 57% of DXY), which brings me to EURGBP.
7/19 – GBPUSD has held the 7/14 low so far so I remain constructive. Again, the hold at VWAPS is significant (see futures chart below) but price is still under 2020 VWAP (bold line on below chart) so Cable is by no means out of the woods. Watch for support now near 1.2535.
EURGBP 4 HOUR

EURGBP has traded sideways since I remarked on the 5 waves down and 3 waves up from the March high. Price put in a bearish outside day today, so the cross might be ready for its next 5 wave drop. .9070s is proposed resistance. The minimum target is a drop under .8670.
6/30 – Maybe Cable is REALLY bullish. I can make the bullish case for GBP crosses in general. EURGBP, for example, sports 5 waves down and 3 waves up since the March high. The 3 wave rally retraced almost exactly 61.8% of the 5 wave decline. .8980-.9000 is the breakdown zone


