Market Update 4/8 – Focus on USDJPY
S&P 500 FUTURES (ES) DAILY
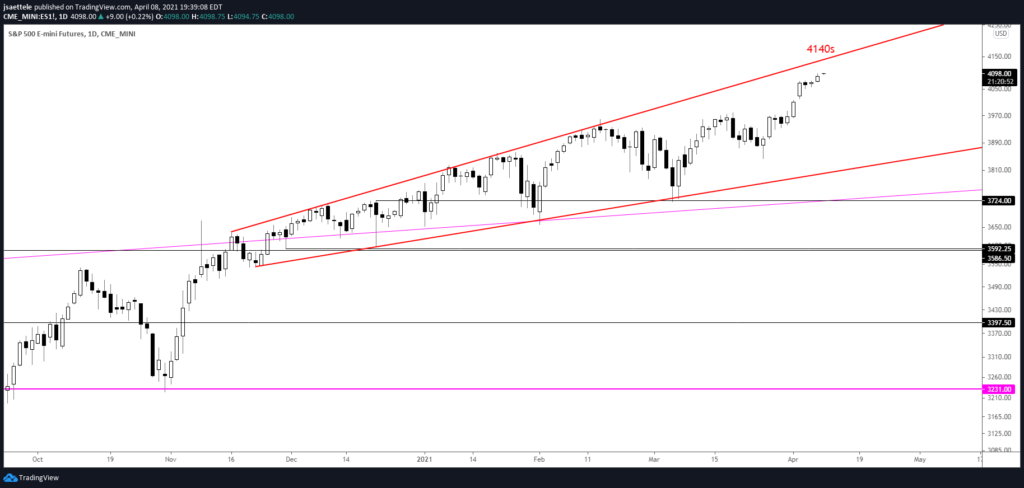
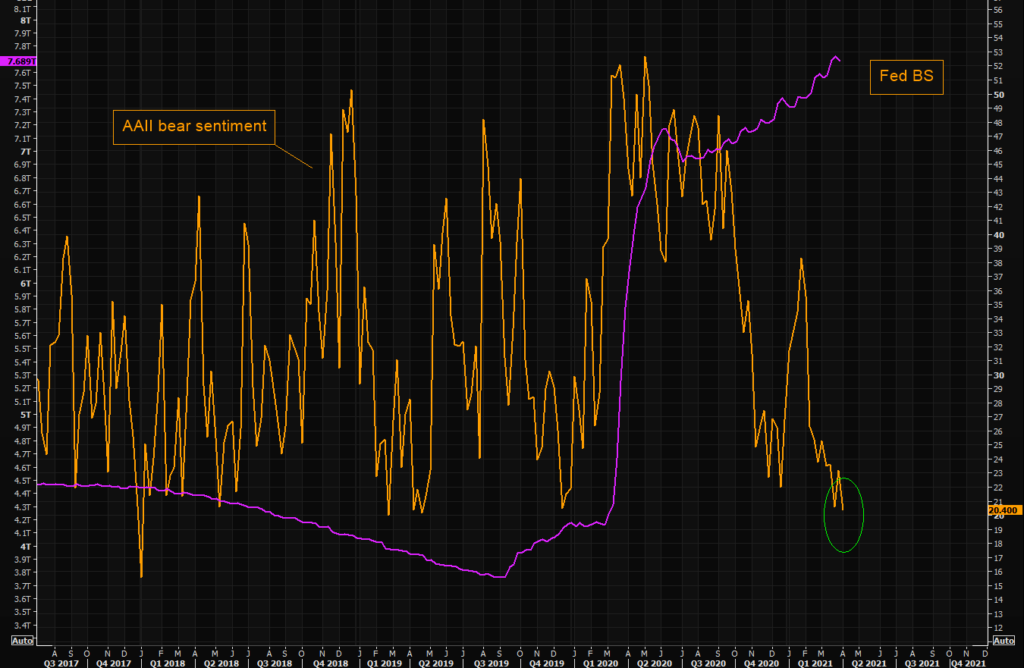
Pay attention to ES at 4140s. This is the line that extends off of highs since November. That simple. Also, bearish sentiment has printed a post-Corona low (see below). Viewed in this light, there aren’t any more bears! To quote George Patton’s eloquent quote regarding herd mentality; ““If everyone is thinking alike, then somebody isn’t thinking.”
AAII BEAR SENTIMENT
SPOT GOLD 4 HOUR
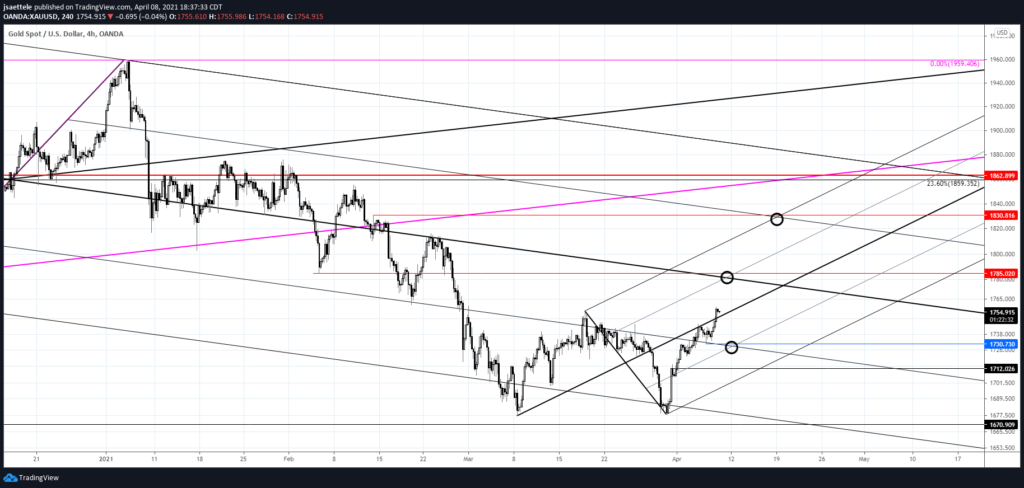
Gold paused and then broke through 1730. That level is now proposed support. 1785 remains a near term upside objective followed by 1830. I’m constructive gold but 1730 needs to hold in order to maintain that view.
4/1 – Gold has broken above the 2021 trendline. Initial upside focus is 1785 (center line of the channel from the 2020 high and February low). Price could pull back from 1733 or so and the top side of the 2021 trendline is now proposed support near 1712.
TLT DAILY
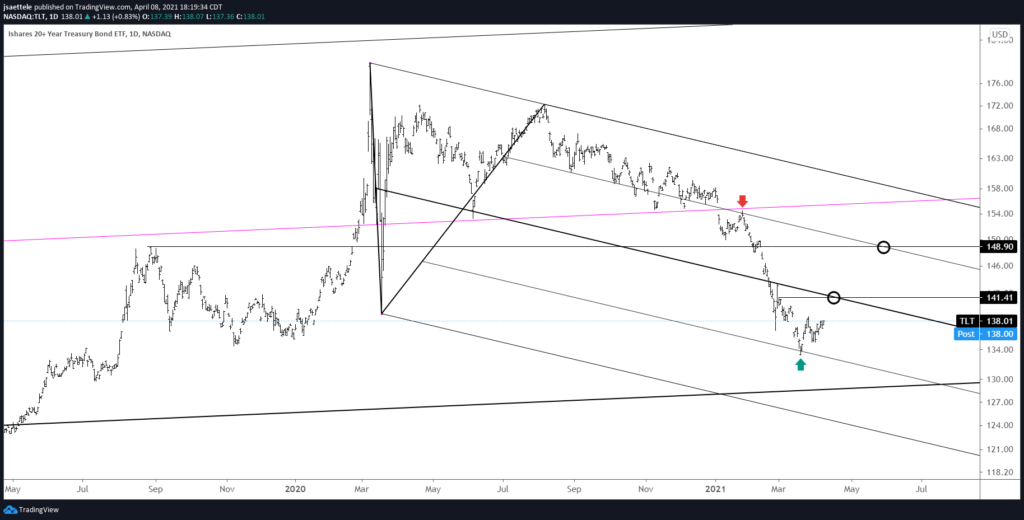
I maintain that TLT action since late February is a bottoming process. Note the arrows at the 25 and 75 lines of within the channel from the March 2020 high. This is a perfect example of median line symmetry. That is, an important reaction at the 25 line is often followed by a reaction at the 75 line and vice versa. Near term focus is higher towards 141.40. A break above there opens up 148.90.
2/28 – TLT reversed sharply at the end of last week, making a 2 day volume reversal. The only other bullish reversals that satisfy the requirements met last week occurred at the 2003 and 2007 lows (see next chart). This recent action is consistent with last week’s call for a low in TLT (high in bonds). Initial upside focus is 149ish.
USDJPY WEEKLY
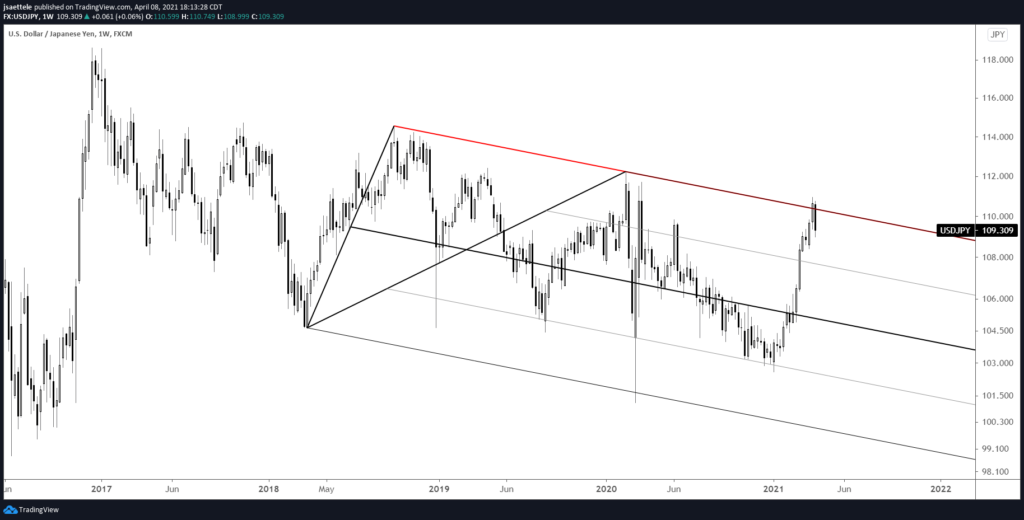
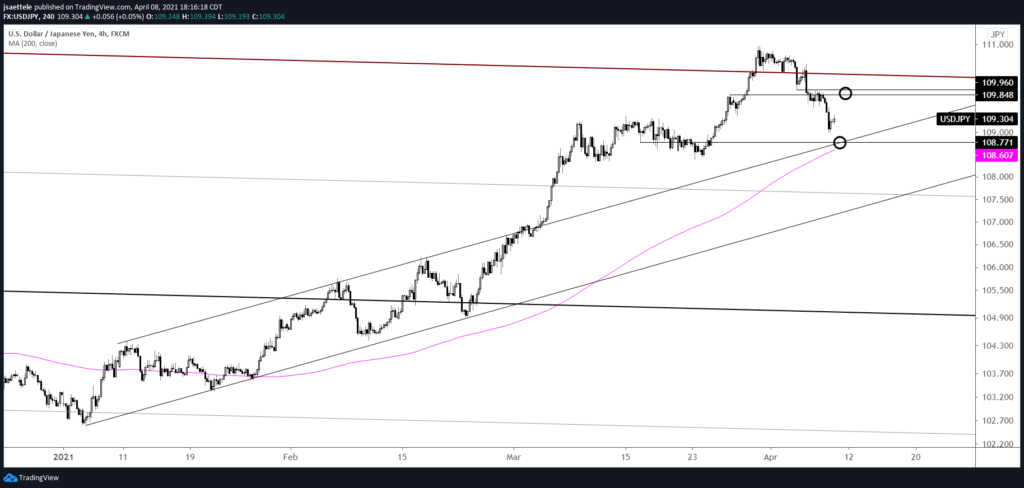
The poke above the 2018-2020 line was short lived as USDJPY has reversed all of last week’s gains. The failed break above this line makes for a bearish setup. Near term, watch for a bounce near 108.80 and for resistance near 109.85-110.00 (see 4 hour chart below). I favor shorts into the proposed resistance zone.
USDJPY 4 HOUR
CADJPY DAILY

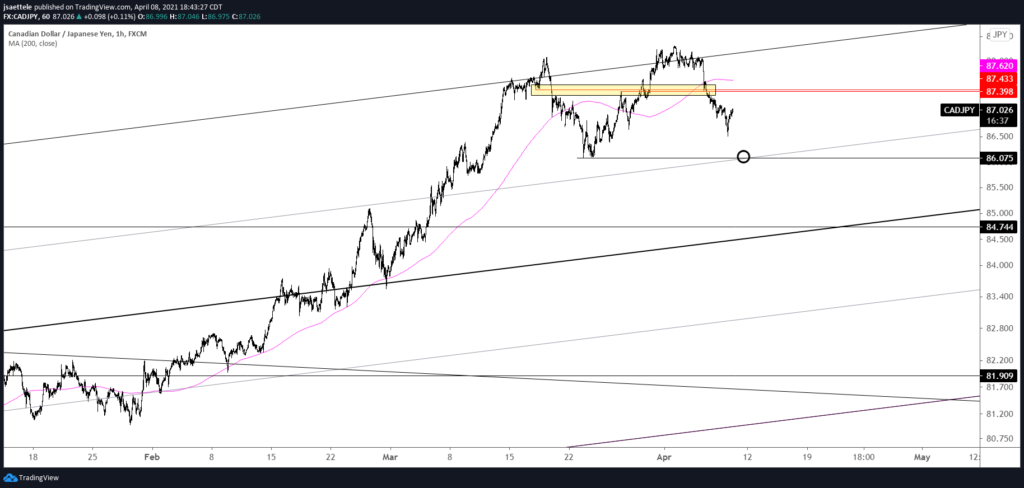
Is CADJPY action since mid-March a topping process? If it is, then a bounce near 86.08 ‘makes sense’. 87.40 is well-defined for resistance if indeed price forming a top (see below). Even a ‘normal’ correction would bring price back to the channel center line, which intersects the February 2020 high at 84.75 at the end of April.
3/18 – After trading along the top of a year long channel for the last 4 days, CADJPY reversed sharply lower today. It’s enough evidence to suggest that a tradable top is in place. I’m looking lower until 85.70s and maybe the channel center line, which is currently about 84.20. 87.60 is proposed resistance now. Daily J-Spikes at at least 500 day highs (roughly 2 years) are shown below for the last 6 years (not bad!).
CADJPY HOURLY
