Introducing FXCopy
Scandinavian Capital Markets introduces its proprietary forex investment platform, FXCopy.

Scandinavian Capital Markets introduces its proprietary forex investment platform, FXCopy.

Right on cue! USDOLLAR reversed lower from parallel resistance (again) today. I’m not sure how important the high is but short term focus is lower for now. The first level to pay attention to will be 11900.

USDCAD has responded to noted resistance (VWAP and the trendline), so focus is lower. A downside level of interest is the 61.8% retrace of the rally from the June low at 1.2313. That level intersects the trendline from late January, which was support in mid-July. In other words, the line is well-defined.

Recently, we detected a fraudulent scheme that is spoofing users by cloning our website and persuading them to open accounts and deposit funds with them.

The silver crash bounced from a median line today. While the action may feel like capitulation, I’m watching for resistance from the line that crosses lows in June and July (red line). That line is about 24.20. Very near term, price could bounce near 23.05 (see below). The 61.8% retrace of the rally from March 2020 is 18.71. Keep that level in mind for major support if reached.

USDTRY has reached the bottom of the proposed resistance zone allow for one more push to test the 61.8% retrace of the decline from the June high. That level is 8.6044. The 50 day average is just below that level. Don’t forget about the contrarian implications from The Economist cover!

he 25 and 75 lines nailed BOTH the high and low today for USDJPY. I’m willing to buy into the center line near 109.15 given the daily volume reversal today (see futures chart below). Near term upside focus is the upper channel line near 110.00.

.7100 might be in play again for NZDUSD. The level has been a pivot since December. It’s also near the 25 line within the channel from the February high. Since the 75 line was support (twice), we should expect resistance near the 25 line (median line symmetry!). .7100 is also the 200 day average.
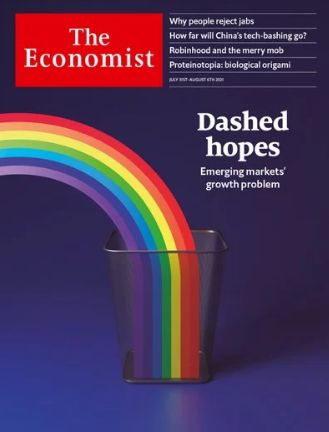
The most recent Economist cover highlights emerging market struggles. Again, check out the post in the link above for an explanation on why magazine covers are useful contrarian covers but the bottom line here is that EM (I’ll dig into EM equities and FX more in the coming days) is ‘sold out’.