Market Update 10/4 – Bigger Kiwi Setup
XLY WEEKLY
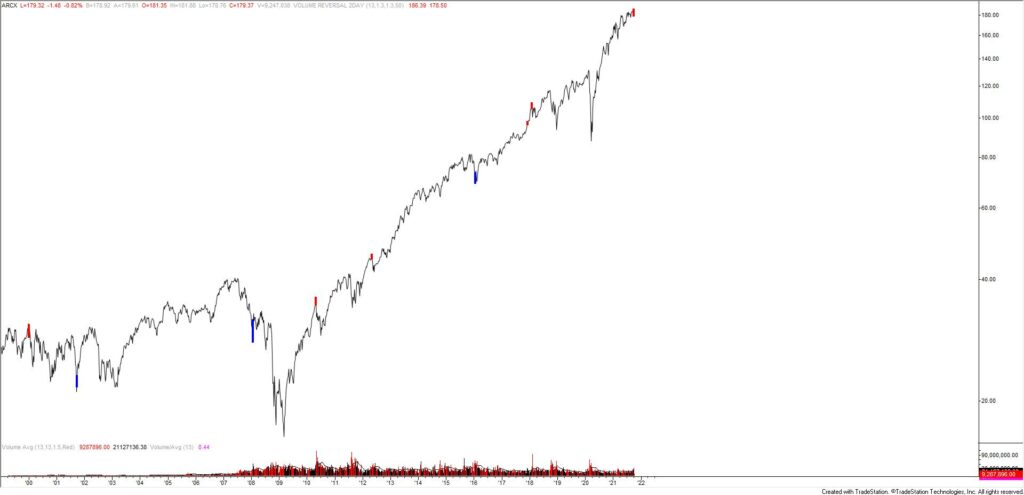
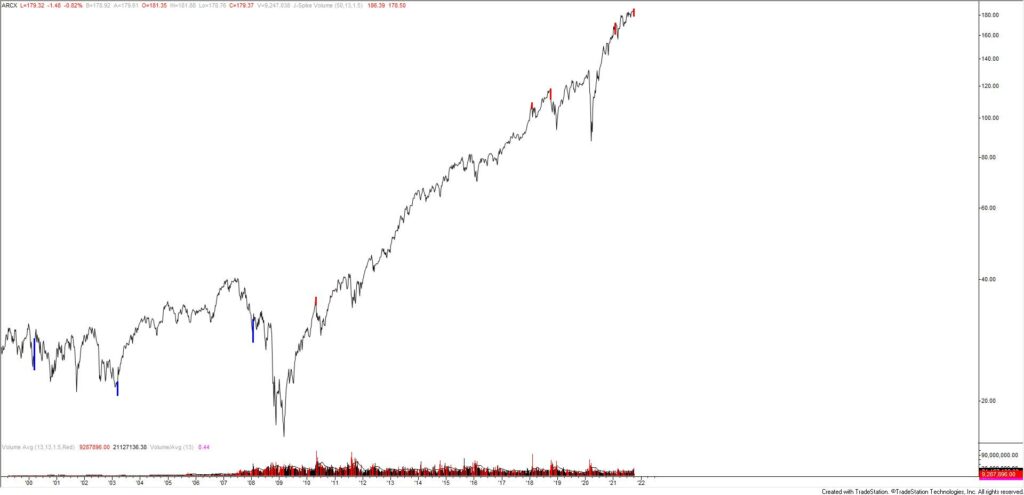
XLY is the consumer discretionary ETF. This two largest holdings are AMZN (22.9%) and TSLA (13.5%). In other words, this is an important ETF with some big names. Last week, both a 2 week volume reversal and 1 week volume reversal triggered. The 2 week signals are shown in the chart below. The 1 week signals are shown 2 charts down.
XLY WEEKLY
NASDAQ FUTURES (NQ) DAILY
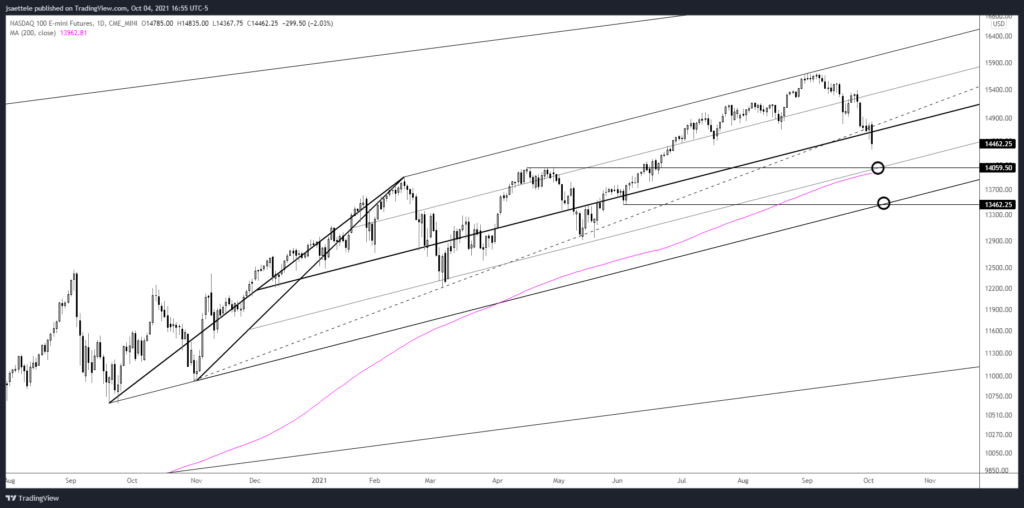
NQ has broken the noted level (trendline and center line). Again, the move indicates an important behavior change. As such, I’m looking lower towards 14060 and then the lower parallel near 13460. The lower parallel is the next big test. 14710-14810 is now proposed resistance.
9/29 – NQ is nearing the trendline from the November low. This is also the center line of the channel from the September low (the upper parallel was resistance so it would be ‘natural’ for price to react to the center line) and the 38.2% retrace of the rally from the May low (14641.50). Bottom line, this is an important test for NQ and a break below would indicate an important behavior change.
GBPUSD HOURLY
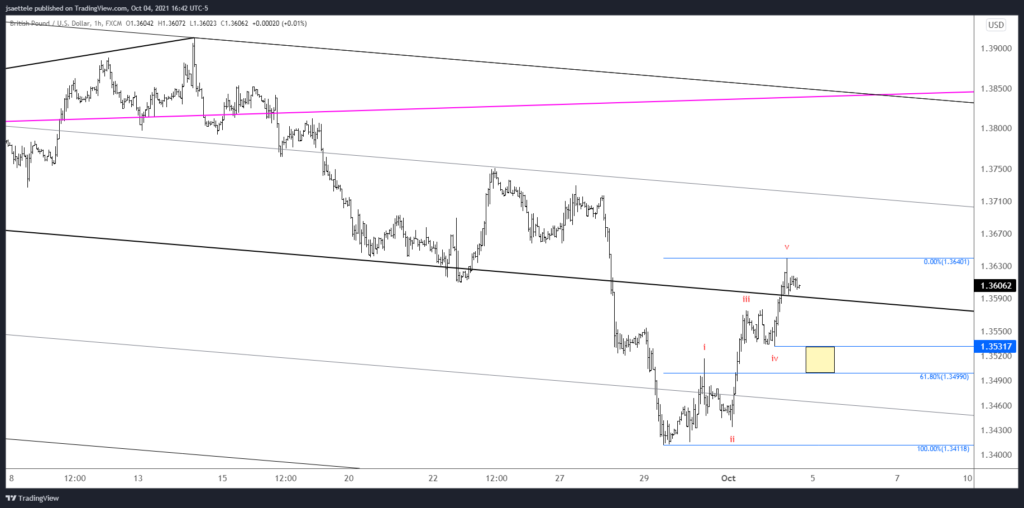
Cable is into 1.3600 but the rally from the low is impulsive (5 waves). The implication is that price pulls back in corrective fashion before resuming higher. In other words, a false breakdown setup is in play. Proposed support is 1.3500/30.
9/30 – Cable is volatile but there isn’t any change to the outlook or trading strategy. I still favor shorting into 1.3600 with 1.3305 as an initial downside objective.
NZDUSD HOURLY
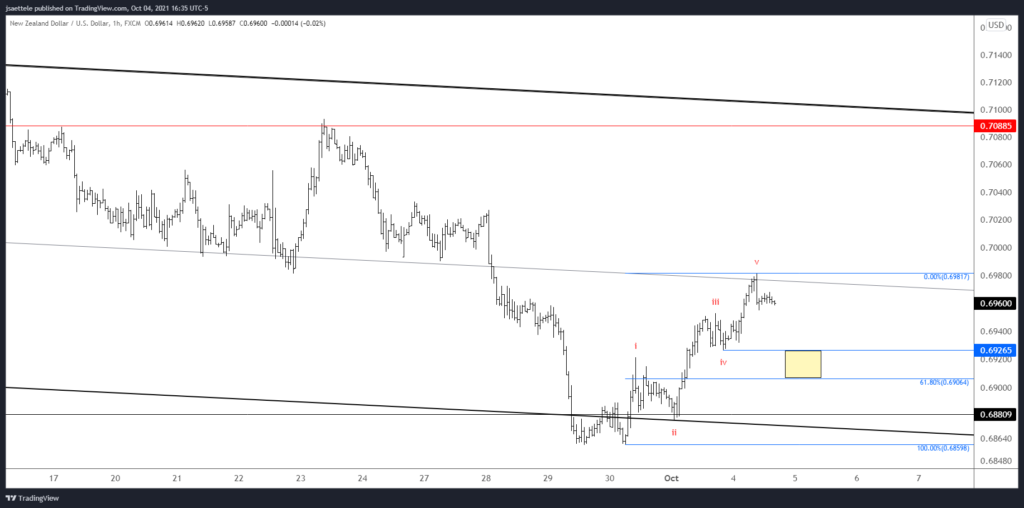
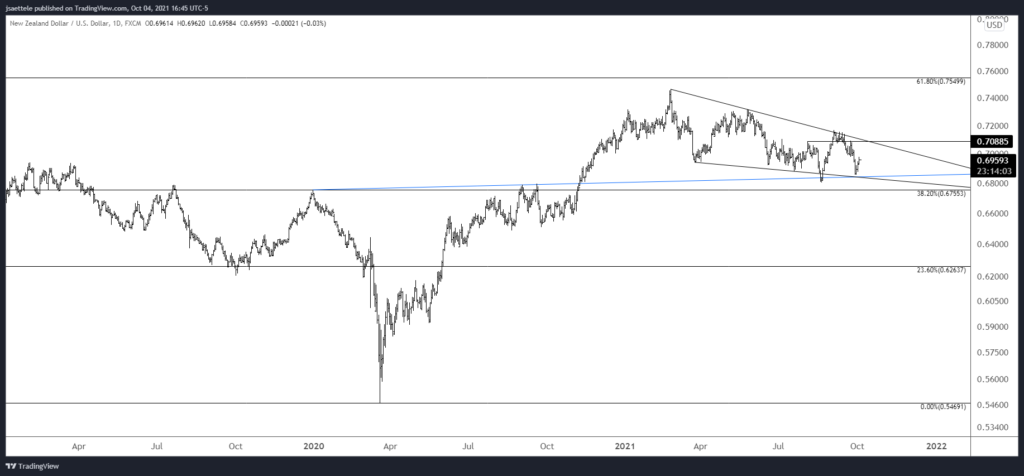
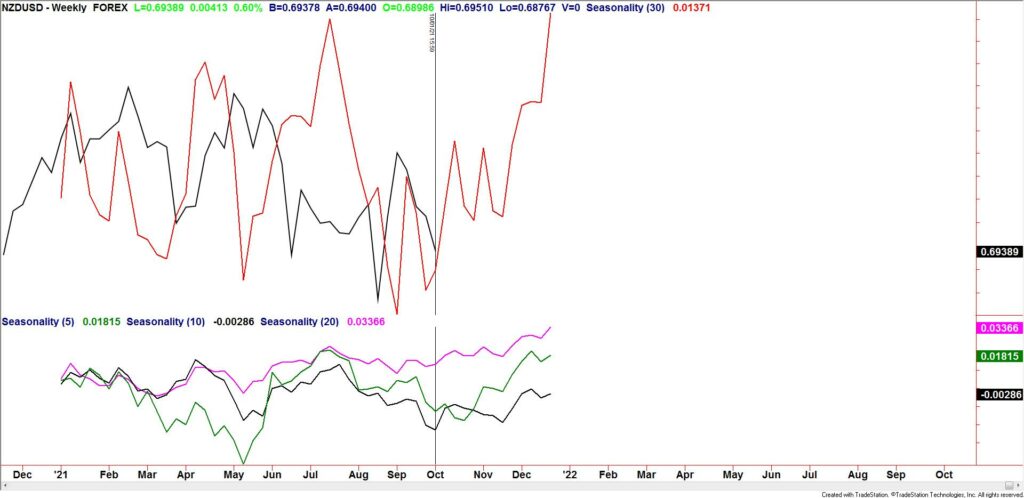
Kiwi is in a situation similar to GBPUSD. That is, the rally from last week’s low is in 5 waves so expectation is for a 3 wave (corrective) pullback before additional strength. Proposed support is .6906/27. Also, don’t forget that NZDUSD has come into long term neckline support and the drop from February could be a bullish wedge (see below). Finally, seasonal tendencies have turned up (see 2 charts down).
NZDUSD DAILY
NZDUSD WEEKLY SEASONALITY
USDCAD 4 HOUR
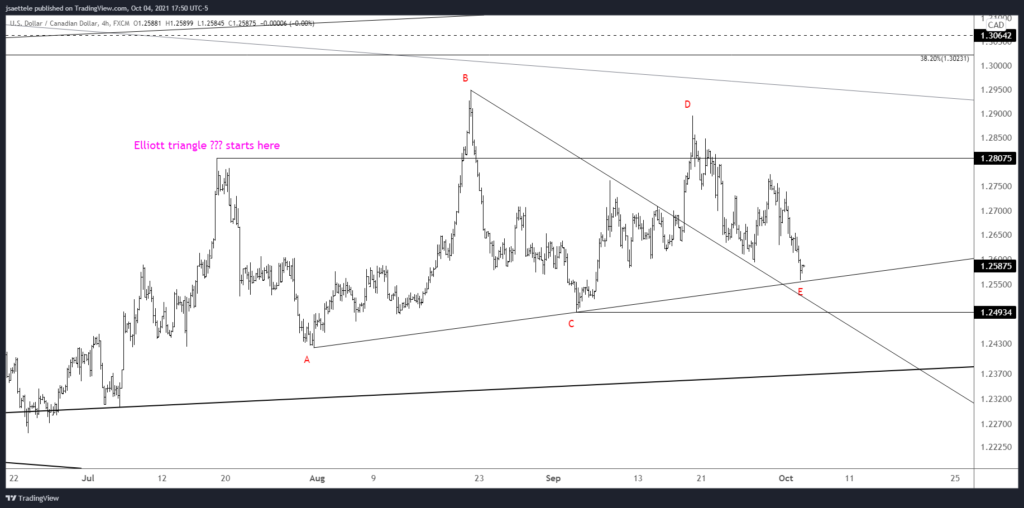
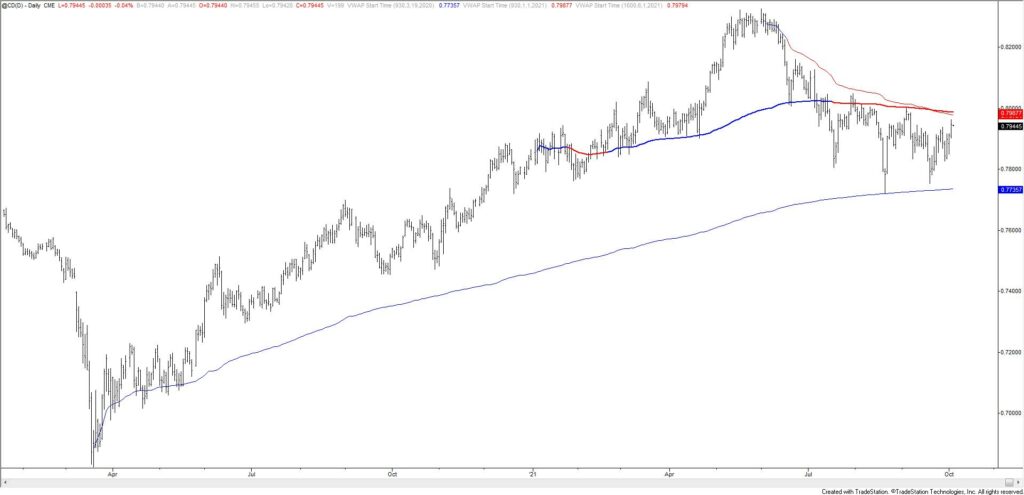
The USDCAD triangle that we’ve been following is still a possibility. However, price needs to turn up soon in order for the interpretation to remain valid. The August-September line is slightly lower. Also, VWAP resistance in CAD futures (USDCAD support) reinforces the level (see below). If a reversal unfolds, then I’ll plot an entry.
CANADIAN DOLLAR FUTURES DAILY
