Market Update: October 13
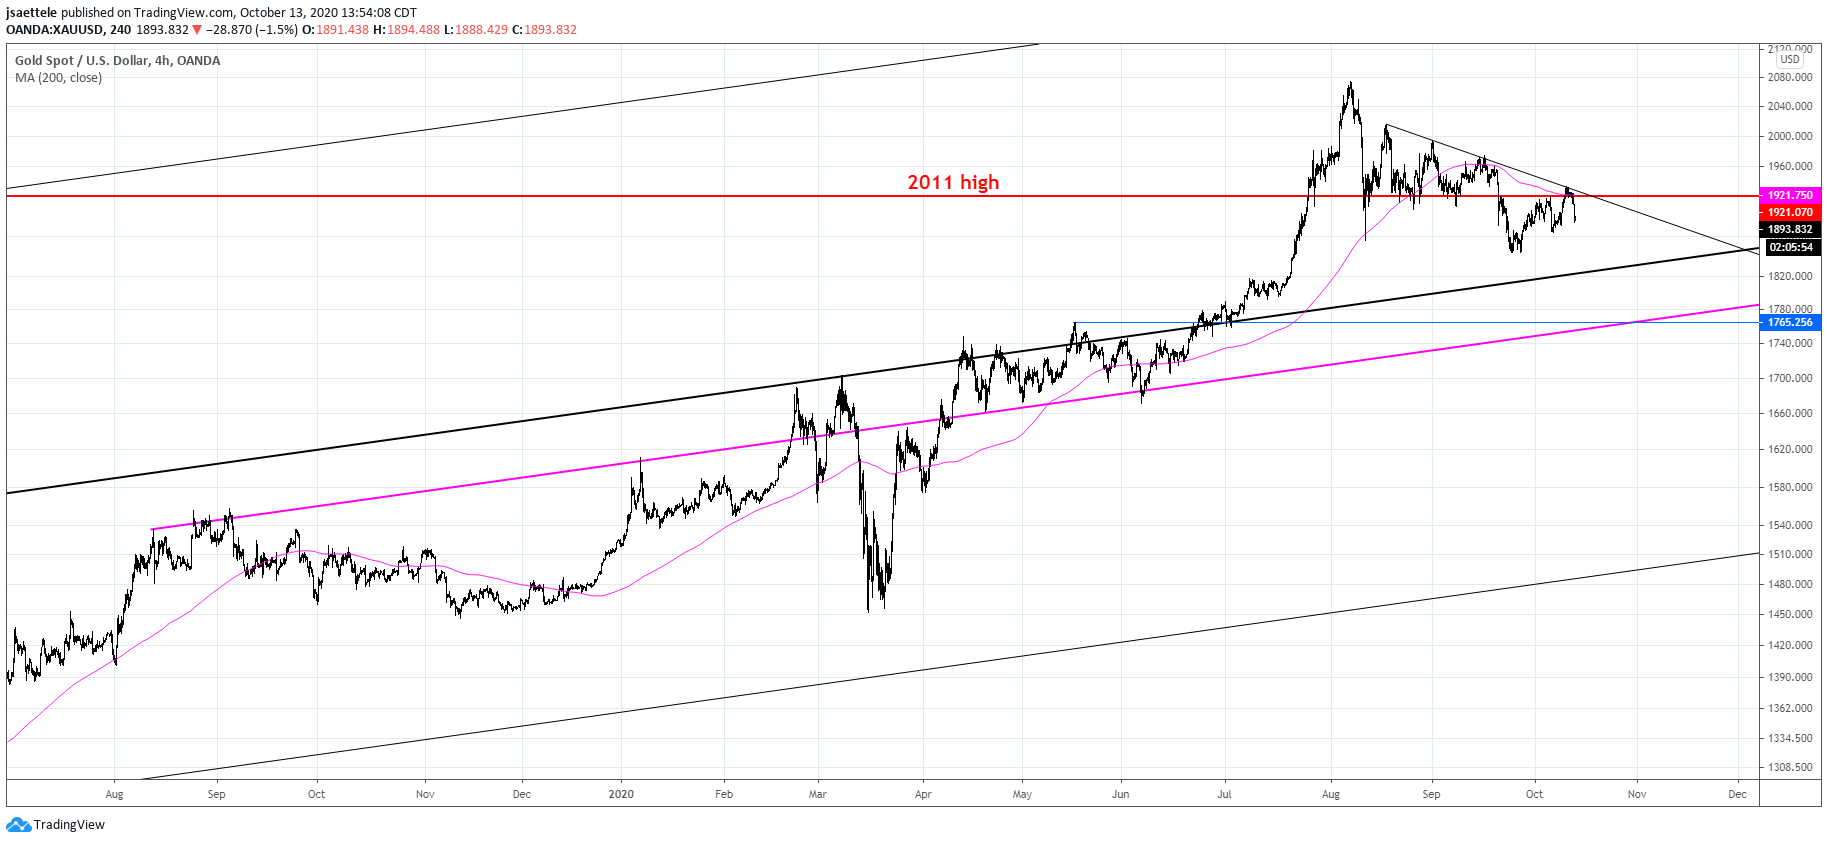
GOLD SPOT 4 HOUR

Gold has turned down from the 200 period average on the 4 hour chart, short term trendline, and 2011 high. Notice the action around the 2011 high over the last few months…gold remembers! Focus remains lower. 1760 appears critical for longer term support. This is the May high, near the 200 day average (daily chart is below), and is a parallel that crosses highs and lows since August 2019.
9/30 – Gold traded into proposed resistance at 1908 today and immediately pulled back. I am of the view that price resumes lower from the current level towards the lower parallel near 1750. Failure to stay below today’s low would risk strength into the upper parallel of the bearish channel near 1940.
GOLD SPOT DAILY

TLT DAILY

TLT action since the March high is looking more and more like a triangle. Whether it’s bullish or bearish is unknown. My guess is that the U.S. elections will have a hand in determining eventual resolution. In any case, price has turned up from a well-defined level…2020 VWAP and the 200 day average. Focus is higher until the upper triangle barrier near 169.
GBPUSD DAILY

Did GBPUSD complete a flat pattern from the 9/11 low? If that’s the case, then GBPUSD is headed sharply lower in the coming weeks. In the interim, pay attention to 1.2890ish for support and 1.3005 for resistance. Proposed support is the lower parallel and VWAP off of the September low. 1.3005 has been a clear level since August (see the next few charts). A reason to suspect that a flat pattern did unfold from the 9/11 low and that the trend is lower is the 4 hour RSI profile (see 3 charts down). Remember, RSI registers readings below 30 at price lows and readings below 70 at price highs in downtrends (the opposite is true in uptrends…readings above 70 at price highs and above 30 at price lows).
10/12 – GBPUSD didn’t quite reach proposed support near 1.2800 (low was 1.2846) and price is again testing the median line of a short term bullish fork. I remain constructive towards 1.3170 and maybe 1.3270. The lower level is the underside of the line off of the March and June lows. This line was resistance in mid-September. 1.3170 is also the 61.8% retrace of the decline from 9/1. The higher level is the 8/19 high and near the upper parallel of the short term fork. If price pulls back then watch for 1.2960s-1.3010 support.
GBPUSD 4 HOUR

BRITISH POUND FUTURES HOURLY

GBPUSD 4 HOUR

EURUSD 4 HOUR

EURUSD is trading right at 1.1750…it seems like this has been the case for months. Anyway, resistance should be 1.1770s now (red parallel). The median line from the bearish fork is about 1.1660 and a possible bounce level now. Eventual downside focus remains 1.1450 or so.
10/12 – Pay attention to 1.1859 in EURUSD. This is the 61.8% retrace of the decline from the 9/1 high. The upper parallel of the bearish fork intersects this level on Tuesday. Weakness below 1.1750 (support in August and September) would put EURUSD back on a bearish path. Seasonal tendencies are now bearish on 5 and 20 year look back periods and turn down after this week for the 10 year look back period (see below).
AUDUSD HOURLY

AUDUSD is trading at an important near term decision point. If price follows through on today’s drop then immediate focus is the center line near .7076. The line that was resistance earlier this month (25 line…highlighted in yellow) would then become resistance again. If price holds and bounces then .7210 is proposed resistance. Broader downside remains .6700-.6800 as per last week’s comments.
10/6 – In July, I was looking at the similarities between AUDUSD now and AUDUSD in 2002. Fast forward and the similarities remain. The 2002 market is shown below. In both instances, price traded outside of the long term channel before dropping back into the channel. If this continues, then AUDUSD comes back to .6700-.6800 (200 day average and 25 line within the channel…just like 2002) or so before finding the next low. An analog is shown 2 charts down. .6800ish is also 2020 VWAP and VWAP from the March low. VWAP from the high held as resistance after RBA on Tuesday (see futures chart 3 charts down). I’d expect resistance near .7130 now.
AUDJPY 4 HOUR

Look at that 200 period average on the 4 hour chart in AUDJPY…impressive! Focus is lower as a result. 75.70s is proposed resistance now (see hourly chart below). Eventual downside is significant as per the failed breakout on a longer term basis (see weekly chart 2 charts down). Downside swing levels to target are 72.00/50 (4th wave support in June and 2 equal legs down) and low 69.00s (50% retrace of rally from March and 161.8% extension).
10/1 – AUDJPY broke short term trendline support on 9/16. The recovery over the last week simply serves to correct short term oversold conditions. Focus for resistance is 76.40 (200 period average on 4 hour chart and trendline). Downside focus is the top side of the trendline from the 2018 high near 71.35 (38.2% retrace of rally from March low).
AUDJPY HOURLY

AUDJPY WEEKLY


