Market Update 9/15 – Big Test in USDJPY
S&P 500 4 HOUR
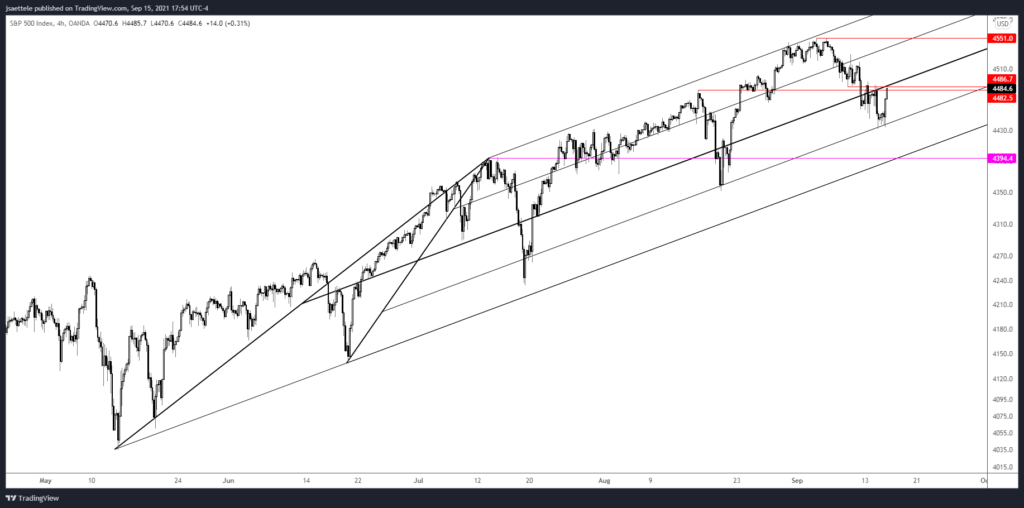
My near term SPX focus is on the channel from the May low. The upper parallel of that channel was resistance for the top which accentuates the importance of the lower parallel as the big test for direction. The lower parallel is about 4394. A break below would be the first indication in a long time that ‘something else’ is going on (behavior change). There are 2 levels to watch for resistance…now and the high at 4551. I reference median line symmetry often. A test of the high would also test the 75 line…which would satisfy median line symmetry since the 25 line was just support. Tactically, I wouldn’t try the short side until either a break under the lower parallel or a test of the high.
AUDUSD 4 HOUR
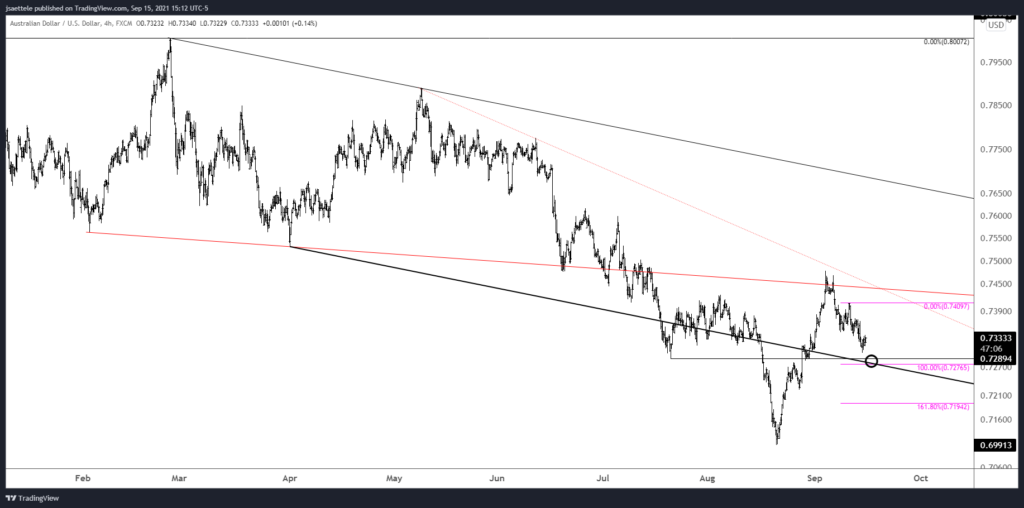
Pay attention to .7277/90 for support in AUDUSD. The bottom of the zone is where the decline would consist of 2 equal legs. If 8/20 is an important low then my ‘guess’ is that .7277/90 is support for the higher low within the new sequence.
9/13 – Not much change in AUDUSD over the last week from a strategic perspective. I continue to favor .7425 for resistance and .7290 or so for support. The annotations on the chart suggest that weakness from 9/3 will unfold as an A-B-C decline but that is subject to change. The most important thing to pay attention to right now is .7425 for resistance.
USDCAD 4 HOUR
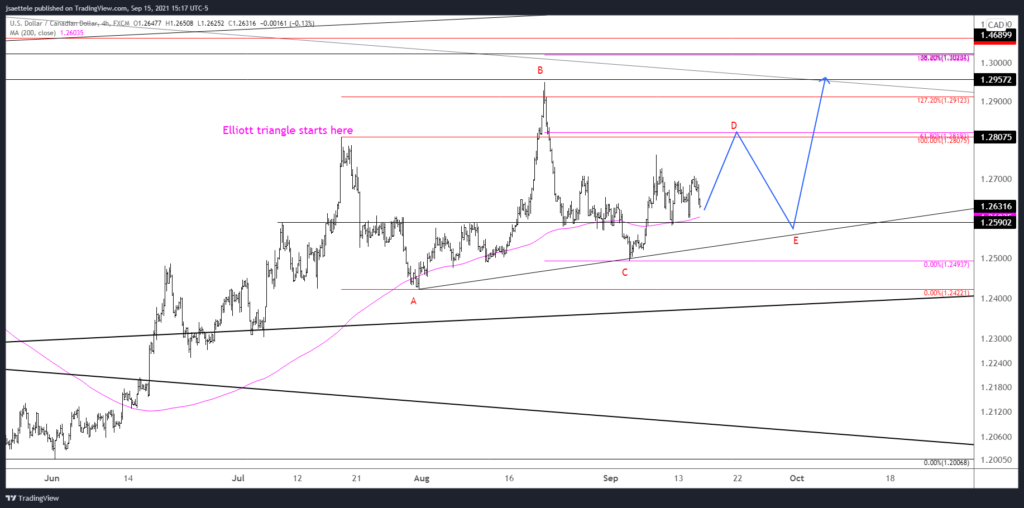
Sometimes, the pattern starts to make sense. That happened today as I was viewing USDCAD. Notice how each leg since the 7/19 high consists of 3 legs. That suggests triangle. Also, proposed wave B is about 127.2% of proposed wave A…also suggests triangle. Within an Elliott triangle, several alternating legs usually relate by 61.8%. If that happens with wave D (now), then this rally will carry to 1.2820 which is in line with proposed resistance anyway. The question is whether or not price undercuts the 9/10 low first. I’m on the lookout for evidence of a turn higher.
9/14 – USDCAD dipped under 1.2625 before turning sharply higher today. Action since late August has the look of an inverse head and shoulders pattern as well. The neckline is 1.2710/30. If price pulls back within the range then watch for 1.2640/50 for support. I’d love a spike on CPI in order to buy into support with a tight stop on Wednesday. I’ve highlighted the bullish RSI profile as well.
USDJPY DAILY
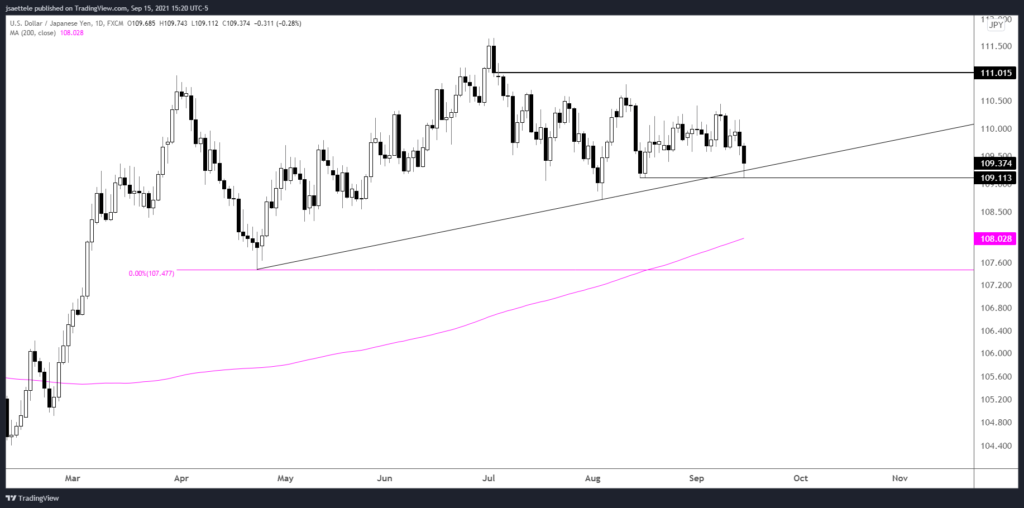
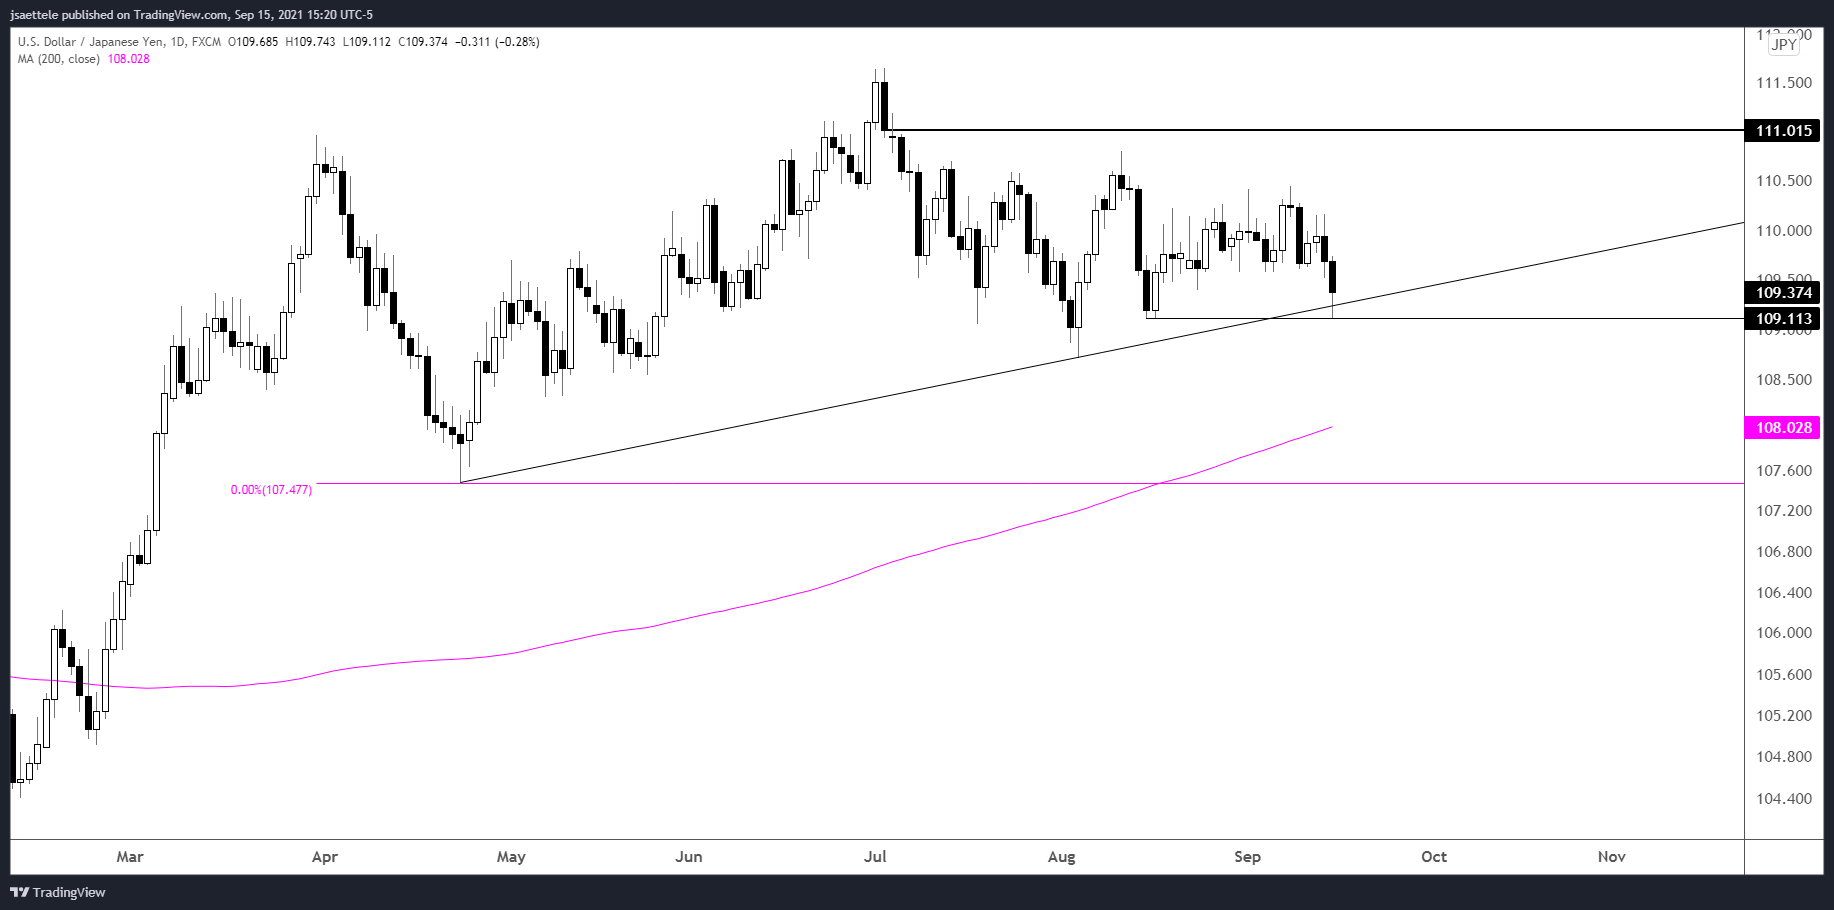
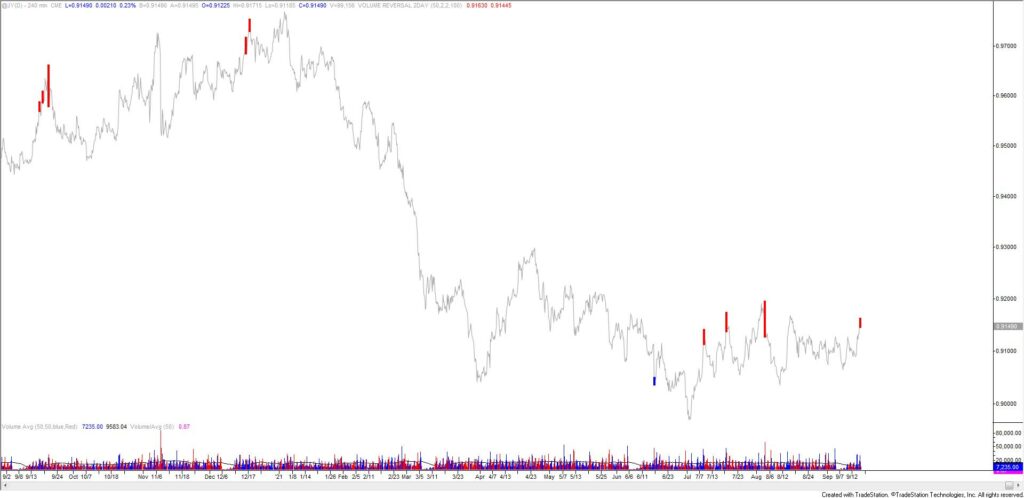
USDJPY is testing a key spot defined by the line off of the April and August lows and the 8/16 low. Recall the bearish setup in GBPJPY (see yesterday’s post) but I’ll note the possibility of a bounce in USDJPY from the current level given the noted level and 4 hour volume reversal in futures (see below…remember that futures are quoted JPYUSD so the chart is ‘flipped’).
JAPANESE YEN FUTURES 4 HOUR
GBPUSD 10 MINUTE
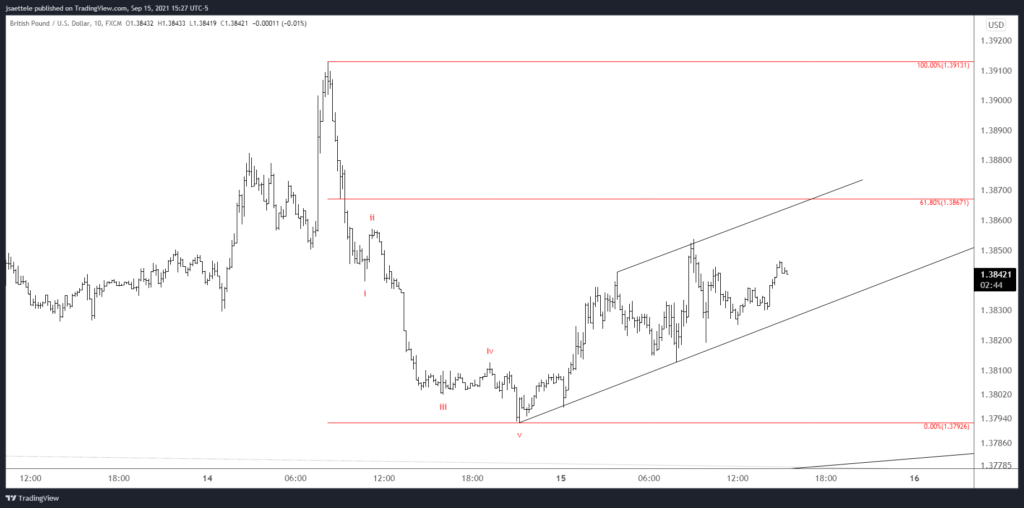
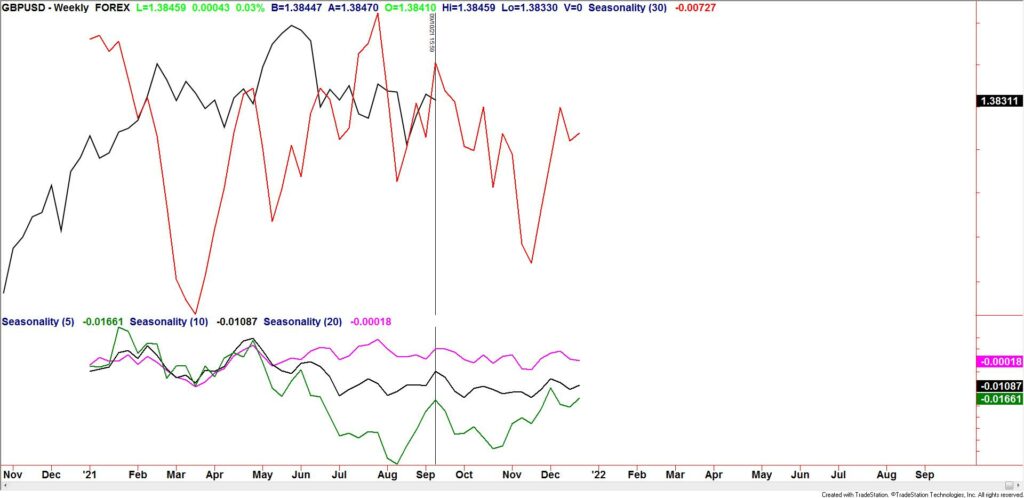
The bearish GBPUSD setup continues to take shape. The drop from yesterday’s high is clearly impulsive and the bounce is clearly unfolding in a corrective manner. The 61.8% retrace at 1.3867 should provide resistance if strength persists. Also, seasonal tendencies are now bearish across all lookback periods (see below). This setup has everything (volume reversal, VWAP resistance, short term Elliott pattern, and seasonality).
9/14 – Cable put in a BIG reversal today. I’m not sure what’s going on from a pattern perspective but today’s reversal was accompanied by high volume. The chart below shows high volume (1 day) reversals in futures. Those are some good signals! Also, note that 2021 VWAP was resistance (2 charts down). ‘Levels wise’, price might bounce from near 1.3775. Watch for resistance near 1.3445.
GBPUSD WEEKLY SEASONALITY
