Market Update – June 8
TLT DAILY
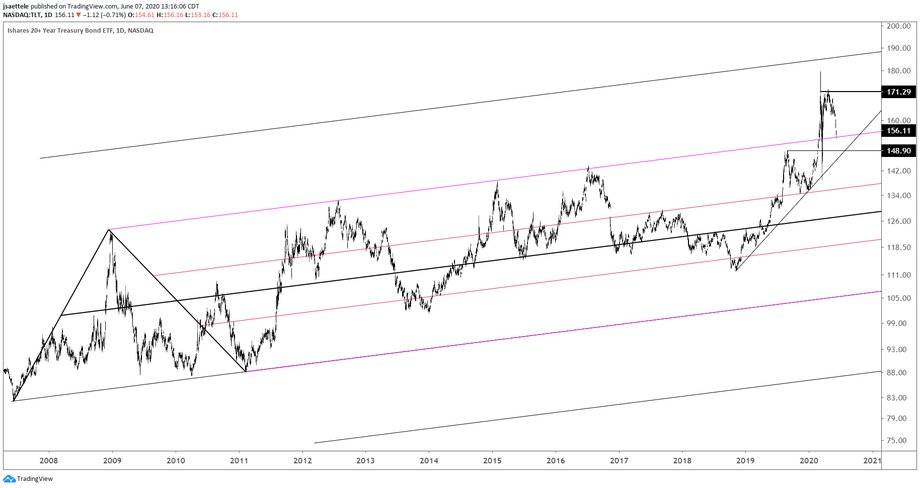
TLT reached the noted support line on Friday and reversed higher. The importance of this line cannot be overstated. This is the same line that was resistance for major tops since 2012. Another leg higher from here is possible but I don’t have a strong opinion on whether or not that happens. Favor the upside as long as Friday’s low holds. 162 is initial resistance.
6/3 – TLT has quietly been breaking down. Pay attention to 154 if reached for support. This is the top side of the upper parallel of the channel from the 2007 low. This line was resistance for years before the blowout move earlier this year. If TLT is going to head for another run, then 154 probably needs hold.
COPPER 4 HOUR

Copper closed last week at 2.5435, just above the noted 2.53. The 200 day average is right here too (not shown). Bottom line, this level is significant so respect potential for a reversal lower. A downside level to keep in mind is the median line from the Schiff fork, which was support throughout May, near 2.41.
6/3 – Copper rallied from support but could turn lower from the current level, which is a line that crosses recent highs. Copper actually diverged from the rest of the ‘risk trade’ today with a down day. If there is another push then the underside of the 2008-2016 line is a huge level to pay attention to near 2.53.
SPOT GOLD 4 HOUR

Spot gold broke the neckline on Friday. I am bearish and looking for a drop to 1605/12 initially and then possibly 1557. In the event of a bounce, 1703 should be resistance. This is the underside of the neckline and 5/8 high.
6/3 – Spot gold is testing the neckline from a head and shoulders top. A break below would set an objective at 1605.27, which is in line with the January high. The September high at 1557 is also a level to know.
EURUSD 4 HOUR

EURUSD reversed lower on Friday. My near term view is for a lower EURUSD but I’ll be watching DXY closely for resistance from the underside of the median line of the channel from the 2011 low (see 6/4 post for DXY analysis) in order to return EURUSD bullish. Resistance for short entry is the high volume level from Thursday at 1.1344. Downside levels to keep in mind early this week are 1.1239 and 1.1148.
6/4 – 1.1350 has been reached and EURUSD has rallied for 8 consecutive days. Since inception of the euro, the record for consecutive up days is 9. This happened in October 1998 and October 2004. 8 days up occurred in November 2002, March 2009, and April 2011. All instances led to at least a minor reaction although most instances occurred near major highs. My belief is that we get a minor reaction.
EURO FUTURES DAILY

USDJPY 4 HOUR

USDJPY closed last week more or less on resistance. Note the importance of 109.70. The level was resistance in late 2019 and early 2020. It was also support in mid-March (circled). The upper parallel from the short term fork was also resistance on Friday. There was also a 4 hour volume reversal on Friday (see chart below). I’m favoring USDJPY downside but would like to view early week price action before determining short entry.
6/2 – After going silent for 3 weeks, USDJPY finally broke to the upside. Today’s close is actually right near the year open (year open is 108.76). Near term focus is 109.38/53 (April high and 61.8% retrace of decline from the March high). Support should be the high volume level from today at 108.30.
JAPANESE YEN FUTURES 4 HOUR

AUDJPY DAILY

There isn’t much to add regarding AUDJPY. Daily RSI is nearly 82 now. Readings above 81.5 are marked with magenta dots. The most recent reading was in September 2014. Readings in December 2012 and January 2013 did NOT mark important highs although minor reactions did occur. The only other times that RSI was above 81.5 was December 2005 (major high) and January 2002 (minor high). Similar to USDJPY, I’d like to see early week price action before plotting an entry.
6/4 – The emergence of ‘risk-on’ / inflation trade is clearly highlighted in AUDJPY. Daily RSI is now above 80 (previous instances are marked with magenta dots). The current level was support in 2016, and resistance in July, December, and January. Also, price is at the top of the channel from the March low (see 4 hour chart below). A setback from here makes sense. 72.40 is proposed support.
AUDJPY DAILY (2012-2013)

AUDJPY DAILY (2002-2005)


