Market Update – August 25
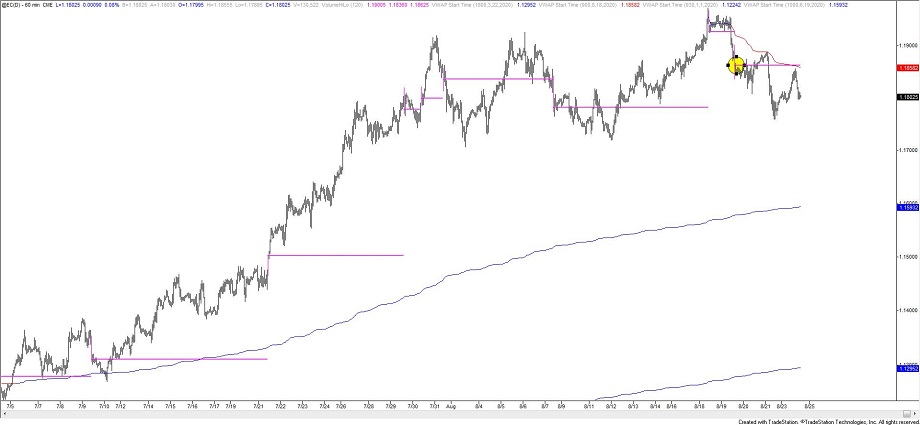
EURO FUTURES HOURLY
3 lower highs and 2 lower lows since the EURUSD high. I like that strength has failed near VWAP from the high twice and that today’s high is near the high volume level (circled) from 8/19. 1.1880 is still resistance if reached and the big test for the bulls remains the lower parallel, currently near 1.1675 (see below).
8/19 – I’m paying attention to the parallels within the channel from the 5/14 low for a precise short entry. The high was on the 75 line within the channel so the most likely spot for the next reaction is the 25 line (concept of symmetry) near 1.1750. This line is important as well because it was resistance throughout July. If price bounces from there then the underside of the median line is proposed resistance. The biggest test for bulls is the lower parallel near 1.1650.
BARRON’S 8/21 ARTICLE
IT’S TIME TO PREPARE FOR A WEAKER DOLLAR
This is a Bloomberg article from Friday. Another contrarian headline. Headlines that contain predictions are the most reliable from a contrarian perspective. If a reporter feels comfortable enough to make a forecast, then the market move in question has most likely played out and about to reverse.
EURUSD 4 HOUR

BRITISH POUND FUTURES HOURLY

If you’ve faded my sentiment regarding GBP the last few days then congratulations. I’ve been whipsawed. Similar to EURUSD, I like that today’s rally failed at both the high volume level from 8/19 and VWAP from the high. The last 4 days also tag trendline resistance from the June 2015 high (see below). I like Cable lower against today’s high towards the 6/10 high at 1.2814 initially.
GBPUSD DAILY

GBPUSD 4 HOUR

AUSTRALIAN DOLLAR FUTURES HOURLY

Australian Dollar futures also failed at the 8/19 high volume level today. The spot chart (see below) shows that today’s high also tagged channel resistance from the 2011 high. Final touch before a breakdown? The short term lower channel line, just above the 8/12 low at .7109, is the breakdown trigger. Initial downside focus on a break is VWAP from the June low and former resistance near .7040. Looking out further, .6680 (see below) or so is a downside level to know. This is a clear horiztonal pivot and top side of the trendline from the 2018 high.
8/19 – AUDUSD made a bearish outside today after tagging the 200 week average (see weekly chart below…recall the similarity to June 2002). Today was the 2nd bearish outside day since 8/7 and 3rd key reversal since 7/31. Proposed resistance is Monday’s low at .7209 and the important test on the downside is the June high and 7/24 low at .7064.
AUDUSD 4 HOUR

USDCAD DAILY

The bullish outside day in USDCAD reinforces the idea that price is headed higher. Trendline resistance from the March high is just under the well-defined 1.3314 level (clear pivot since November). Strength above there would put focus squarely on the noted 1.3715 although I’ll note the 8/7 high at 1.3399 as a possible reaction level.
8/19 – USDCAD turned up today after trading under the 200 week average. The 200 week average has historically been a great trend filter and pivot. I love that price has turned up from the top side of the trendline from January 2016, the line off of the 2017 and December 2019 lows, and the 200 week average. Broad upside focus is 1.3660-1.3715. The top of this zone is the 6/26 high and 38.2% retrace of the decline from March. The high volume level today is 1.3191, which is also the 8/13 low. Watch there for support.


