Market Update – May 22
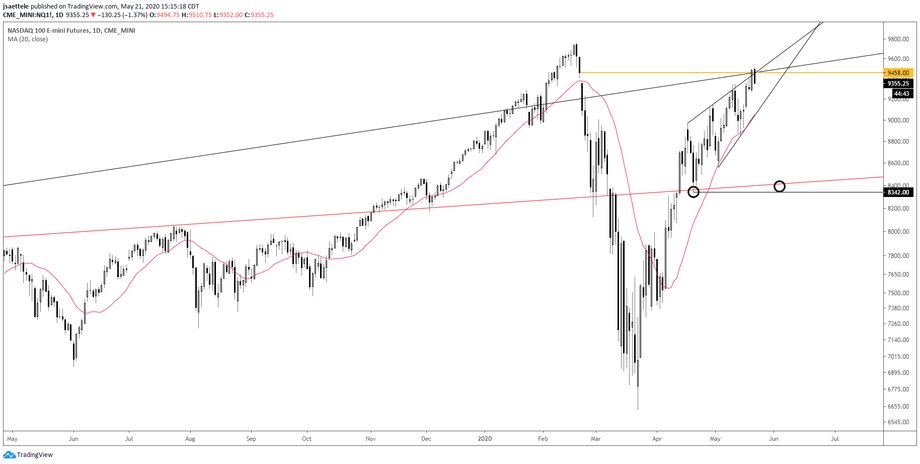
NASDAQ FUTURES (NQ) DAILY
Nasdaq futures and QQQ (weekly QQQ is below) covered their closes from 2/21 on Wednesday and closed beneath those levels today. Mistrust of strength has been misguided but the gap fill and down day today at least presents a bearish risk point (Wednesday’s high). Also, Wednesday’s high is on the upper parallel from the fork that originates at the 2002 low. This line was resistance in 2018 (overthrow in February). Action since 4/21 is a wedge (ending diagonal in Elliott), which tend to resolve with sharp reversals. Imediate focus is on the lower wedge line and 20 day average at about 9055. A break there opens up 8340-8400.
QQQ WEEKLY

SMALL TRADER SENTIMENT

I came across this chart yesterday from SentimenTrader. Retail sentiment, as evidenced by options activity, indicates extreme bullish sentiment…more extreme than just before the February high in fact. This is bearish when viewed through a contrarian lense.
SPOT GOLD (XAUUSD) 4 HOUR

Spot gold pulled back to the lower end of the noted support zone today. As long as the top side of the former triangle line holds (currently about 1713), I am contructive. Be quick to abandon ship quickly though given the possibility of a terminal thrust from a triangle that I described 3 days ago.
5/18 – Gold is pulling back to the top side of former triangle resistance. If gold is bullish, then suppport should be 1716/22. I’m looking to buy in that zone for resumption of upside. If the noted zone fails to hold, then gold would turn extremely bearish because the recent breakout would be considered a completed terminal thrust from a triangle.
USDOLLAR HOURLY

The USDOLLAR is stuck between a rock and a hard place. Price is bouncing from major support (see long term chart inyesterday’s post) but downside potential is significant from an Elliott perspective. In other words, a bearish break is ‘favored’ soon. Until that happens, trading on either side of the USD (unless extremely short term) is not a high confidence wager. I am still thinking that this bounce finds resistance near the underside of the line off of the Aprl and May lows. That’s now about 12530. As for specific zones/levels in USD crosses, my focus for USD resistance is
EURUSD 1.0870-1.0910
GBPUSD 1.2160
AUDUSD .6500/20
NZDUSD .6050/70
USDCAD 1.4010
5/20 – It ‘feels’ like the USD is on the verge of breaking down. That said, USDOLLAR is back into important support (line off of 2011 and 2014 lows and a major horizontal level…see weekly chart below). Support is support until broken so respect bounce potential with resistance near 12520.
USDJPY 4 HOUR

I am contstructive as long as USDJPY is trading within the the short term bullish fork. The lower parallel is about107.20 so the breakeven stop should be safe is upside is going to resume. A high volume level at 107.47 also defends the trade. Nothing else to add other than noting that Japanese inflation (lol) nunbers will be out today along with the BoJ rate decision.
5/19 – If USDJPY follows through on the head and shoulders bottom, then the target is 109.38. This is the origin of the wedge (wedge breaks often return to their origin) and just under the 61.8% retrace (not shown) of the decline from 3/24. Watch for support near 107.50 (4/30 high, 25 line of short term bullish fork, and 200 ma on 4 hour chart).
COPPER 4 HOUR

Even if copper is headed to 2.53-2.56 (2 equal legs up would be 2.5350), price could pull back to 2.3580 or so (blue line) before resuming higher. Maybe a bigger pullback in AUDUSD too?
5/20 – My ‘guess’ is that copper strength (and probably AUDUSD strength as well) persists until 2.53-2.56. This zone is defined by the underside of the 2008-2016 line, lows in 2018 and 2019, and 200 day average.
AUDUSD HOURLY

AUDUSD made an inside day today and is sitting right on the April and early May highs. A high volume hour triggered today at .6568. Use that as a reference point. If price breaks below the short term trendline (dashed line on this chart), then I’ll favor the short side until .6500 (200 hour average and 25 line of a short term channel…notice how the the 25 and 75 lines have been ‘in play’). This is very short term.


