Market Update – June 5
QQQ HOURLY
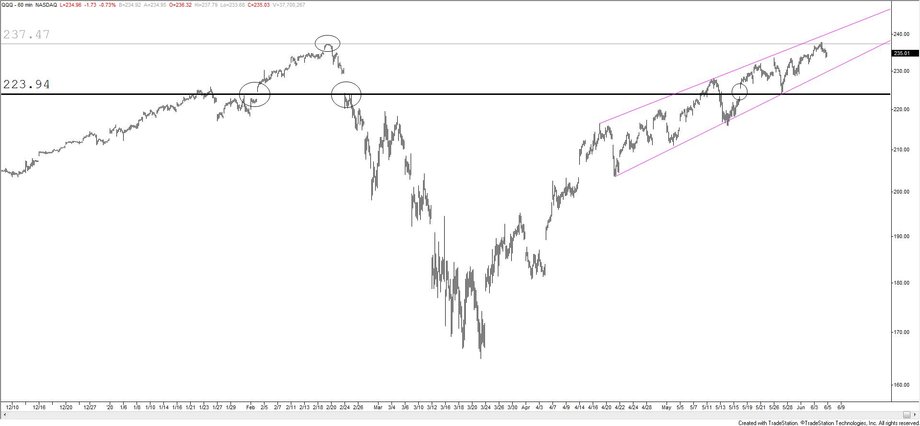
QQQ traded to an all-time high on Wednesday and at today’s open before ending the day down slightly. It’s interesting that the Nasdaq Composite and Nasdaq futures have not traded all-time highs yet. S&Ps have not either. I’m not sure if this non-confirmation means anything. Time will tell. 223.94 is still seen as an important level (call it the ‘breakage’ point) but weakness under the lower diagonal line (lower magenta line) near 230 would be enough for me to suggest that the uptrend has broken.
5/28 – QQQs turned down at the end of the day but a break below 223.94 is needed in order to break the uptrend. If/when that happens, it might occur with a gap as QQQs have gapped through this level multiple times this year. If we get a final surge then pay attention to the all-time high at 237.47, which intersects the line that crosses highs since late April. Finally, divergence with hourly RSI indicates a market at risk of reversing lower. The the same thing happened at the low in March.
EEM DAILY

EEM (emerging markets ETF) has traded to a massive level. Wednesday’s high was 40.52. That’s the exact close from 2/28, which was a high volume day. The level is also defined by the 61.8% retrace of the decline from January, 200 day average, and underside of the line off of the 2018 and 2019 lows. This is resistance so I’m thinking lower. The position of the EEM chart is important for other reasons. One of the more important drivers for EEM is a weaker USD. So, EEM at significant resistance ‘fits’ with a near term low in the USD.
DXY MONTHLY

The lower USD call is getting popular as evidenced by FT article today – Wall Street strategists say dollar could be set for ‘dramatic’ falls.
I do believe that the USD is in for a ‘dramatic’ fall (61.8% retrace of the 2001-2008 decline has been resistance for years and the spike high in March failed at the line off of the 2002 and 2017 highs) but these types of headlines tend to appear near short term pivots. Ideal resistance is 98.50s, which is the underside of the center line of the channel from the 2011 low (see daily chart below).
DXY DAILY

EURUSD DAILY 1998-2004

1.1350 has been reached and EURUSD has rallied for 8 consecutive days. Since inception of the euro, the record for consecutive up days is 9. This happened in October 1998 and October 2004. 8 days up occurred in November 2002, March 2009, and April 2011. All instances led to at least a minor reaction although most instances occurred near major highs. My belief is that we get a minor reaction.
6/2 – EURUSD nearly made it to 1.1200 today. Whether or not price takes out today’s high, I am ‘thinking’ pullback with support in the 1.1080-1.1100 zone. The upper parallel of the channel from the March low is an eventual target near 1.1350.
EURUSD DAILY 2009-2011

GBPUSD 4 HOUR

GBPUSD is nearing the April high at 1.2648. This is a natural level for a reaction lower. Futures have also reached 2020 VWAP and VWAP off of the December high is slightly higher. Bottom line, GBPUSD is into proposed resistance so I’m thinking pullback and support near 1.2485.
6/1 – GBPUSD has broken out and near term focus is on the median ine near 1.2800 with significant longer term upside potential. Support should now be 1.2420s or so, which is the top side of the line crosses recent highs.
BRITISH POUND FUTURES 4 HOUR

USDCAD DAILY

1.3330-1.3460 is quite the zone for USDCAD. The zone includes the 200 day average, 2 legs down from the March high, 3/6 gap, September high, and November high. The bottom of the channel is towards the lower end of this zone over the next few days. With both Canadian and US jobs tomorrow, we could get a capitulation low. The center line is still in line for resistance, currently near 1.3630.
6/1 – USDCAD has broken down sharply and several levels to pay attention to on the downside are 1.3421 and 1.3328. The higher this level is the 3/6 gap and lower parallel of the channel from the March high. The lower level was resistance in November and February, and support in early March. Proposed resistance is the center line of the channel from the March high, which was recently support. This line is about 1.3700.
USDCHF 4 HOUR

The USDCHF channel from the March high should present an opportunity to short. .9590-.9615 is proposed resistance from former support, the 25 line of the channel, and a parallel just below the 25 line. The center line should be watched for support near .9525.
AUDJPY DAILY

The emergence of ‘risk-on’ / inflation trade is clearly highlighted in AUDJPY. Daily RSI is now above 80 (previous instances are marked with magenta dots). The current level was support in 2016, and resistance in July, December, and January. Also, price is at the top of the channel from the March low (see 4 hour chart below). A setback from here makes sense. 72.40 is proposed support.
6/3 – AUDJPY is testing the line off of the 2018 highs. Daily RSI is above 79 as well. Magenta dots indicate instances when RSI has been above 79 and signifies reversal risk.
AUDJPY 4 HOUR


