Education
July 24, 2020
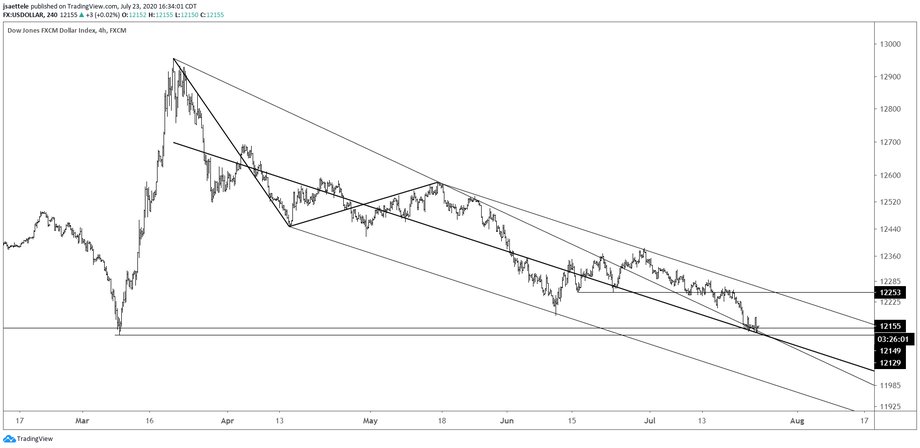
USDOLLAR (EUR, GBP, AUD, and JPY) is testing a major level (daily chart is below). Price reacted today at the top side of the center line of the Schiff fork from the March high and the top side of the line off of the March and May highs. This is a great spot for a bounce. Pay attention to the upper parallel and former support at 12253. A break above there would indicate an important behavior change.
July 21, 2020
I’m not sure what to say anymore when it comes to indices. NYSE breadth, for example, was negative today (more stocks down than up) but both the S&P 500 and Nasdaq were up. The Nasdaq was up A LOT thanks to MSFT and AMZN.
July 8, 2020
Risk’ may have put in an important high today. The following charts ‘explain’ why.
June 11, 2020

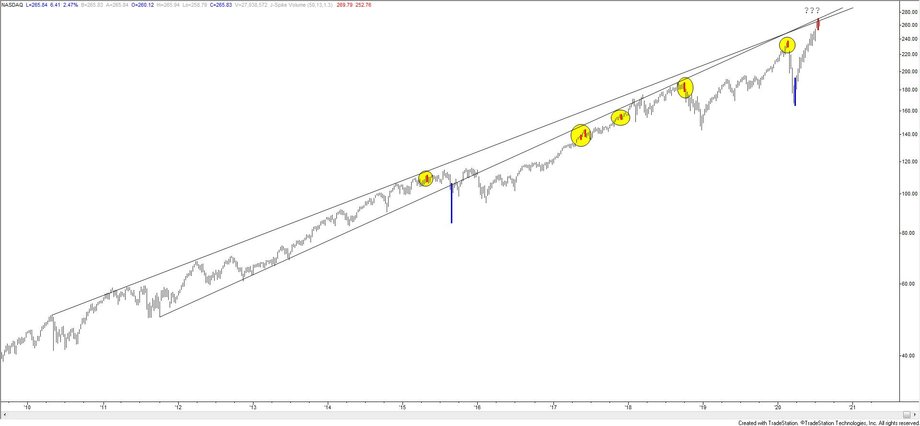
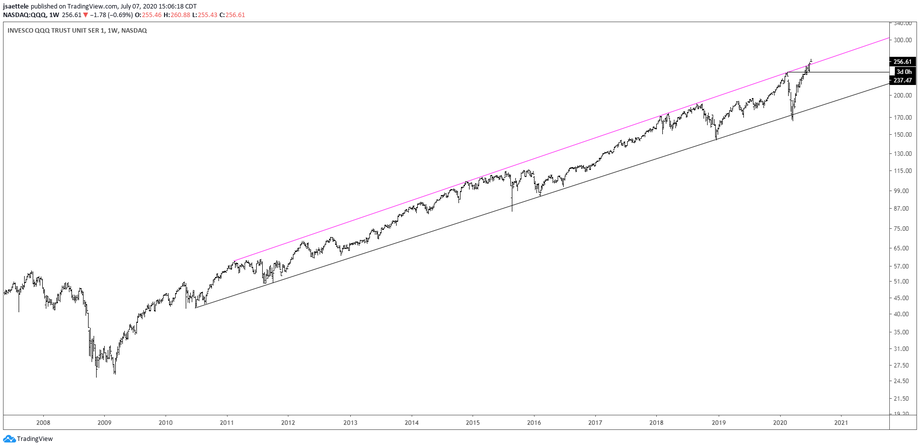
QQQ is running into lines that extend off of highs over the last 9 years. A close-up view is below. The red line extends off of the December 2014 and March 2018 highs. That line was resistance for the August 2018 and February tops. It was reached today. The line that originates at the February 2011 high is slightly higher…about 251.70 in QQQ.
May 29, 2020

Be aware of 3136 in SPX as a possible pivot. The level is defined by the 78.6% retrace of the decline,March high, and the line that crosses highs in 2018 and 2019. This line was support in December. Price has responded to Fibonacci retracements (23.6%, 38.2%, and 61.8%) during the advance which increases confidence that ‘something’ happens at the next Fibonacci retracement.
May 14, 2020
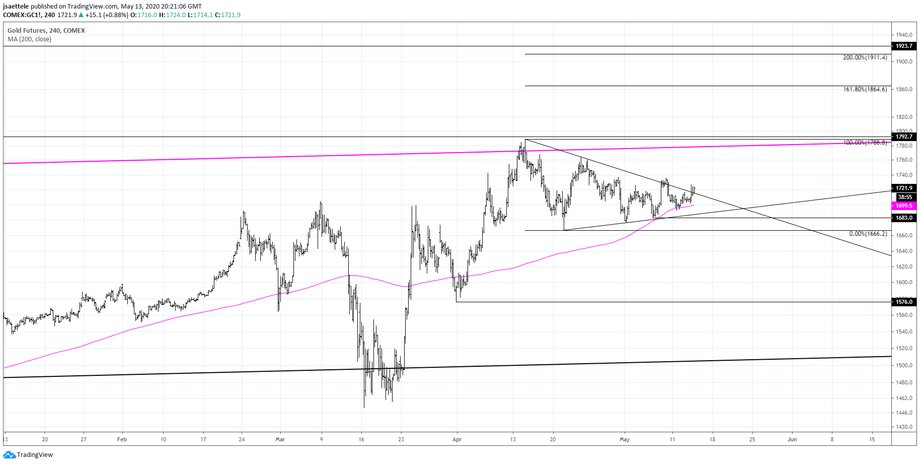
I like to say ‘resistance is resistance until it’s broken’. Gold has been consolidating in a triangle since the April high and is testing the triangle resistance. Triangles tend to resolve in the direction of the previous trend…in this case higher (triangles can occur at highs as consolidation tops…the key is to wait for the break). At the current juncture, I lean bullish. The triangle objective is 1911, which is just under the all-time high of 1923.70. Spot gold (see below) is just under its triangle resistance line and the equivalent objective is 1834.