Education
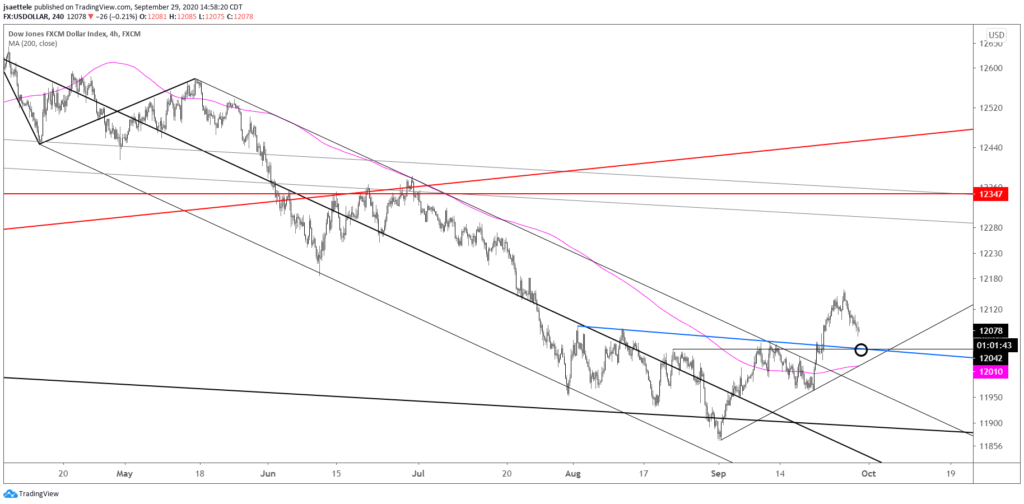
September 29, 2020
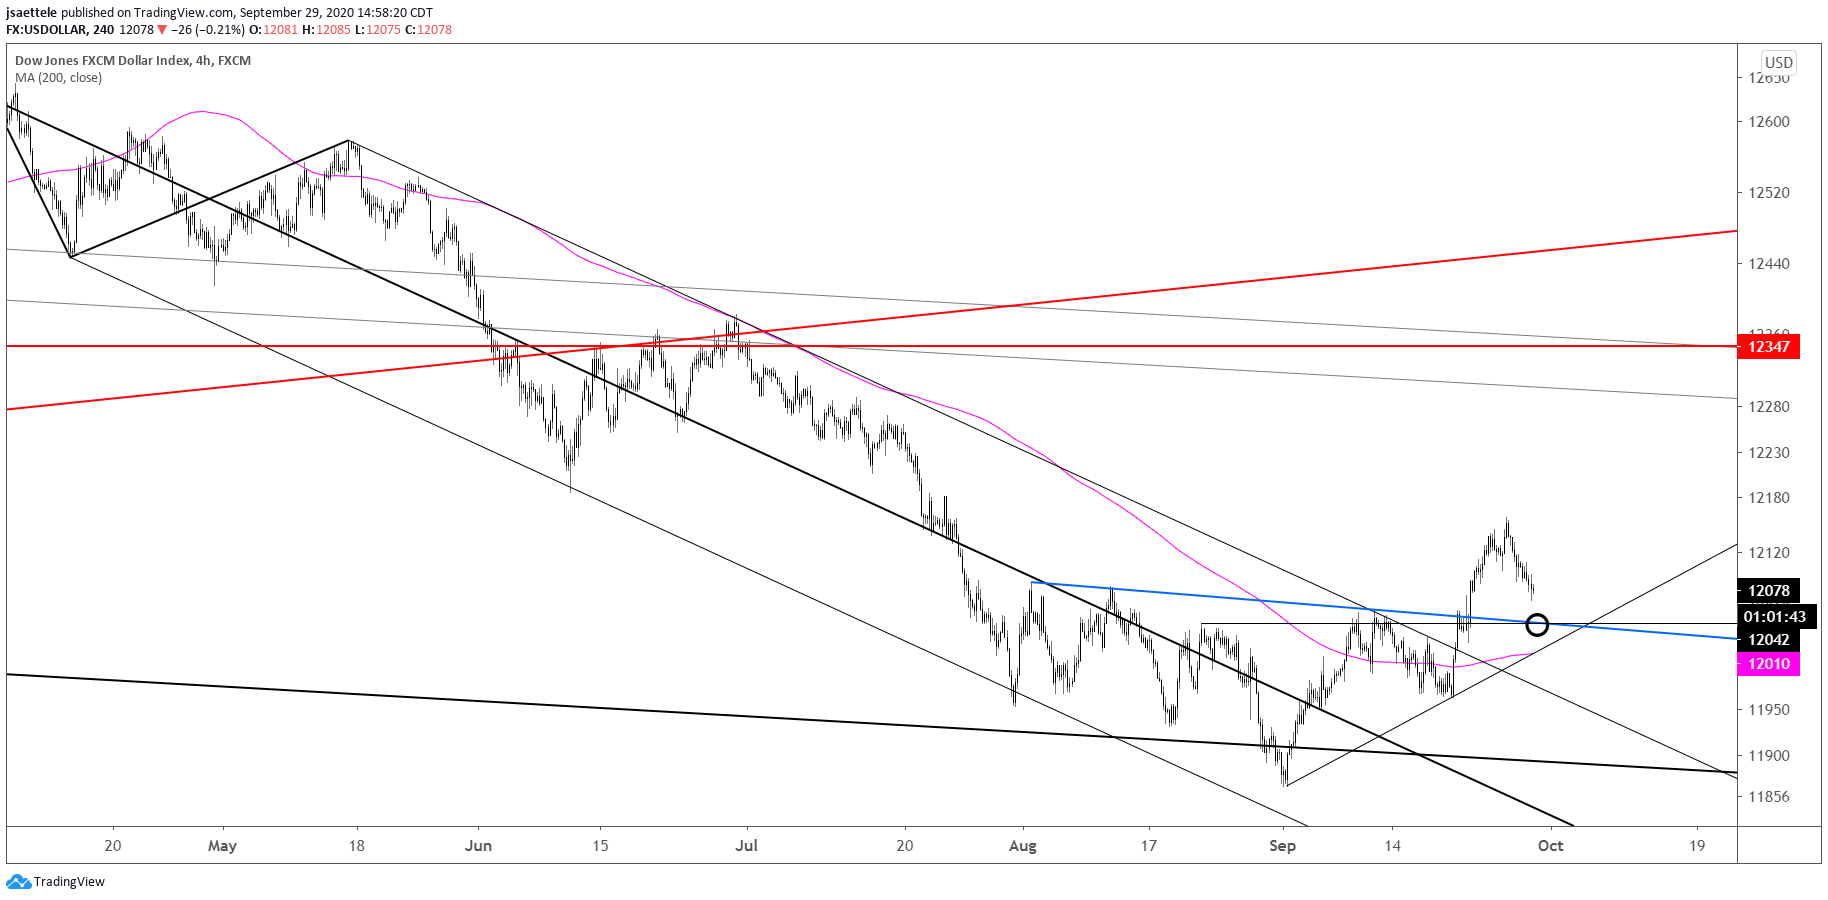
We looked at DXY yesterday, remember that the neckline is 93.50 and proposed support for that index. USDOLLAR is nearly identical with the neckline near 12040. I’m in the re-test of the breakout level (neckline) and then higher for the USD.
September 15, 2020
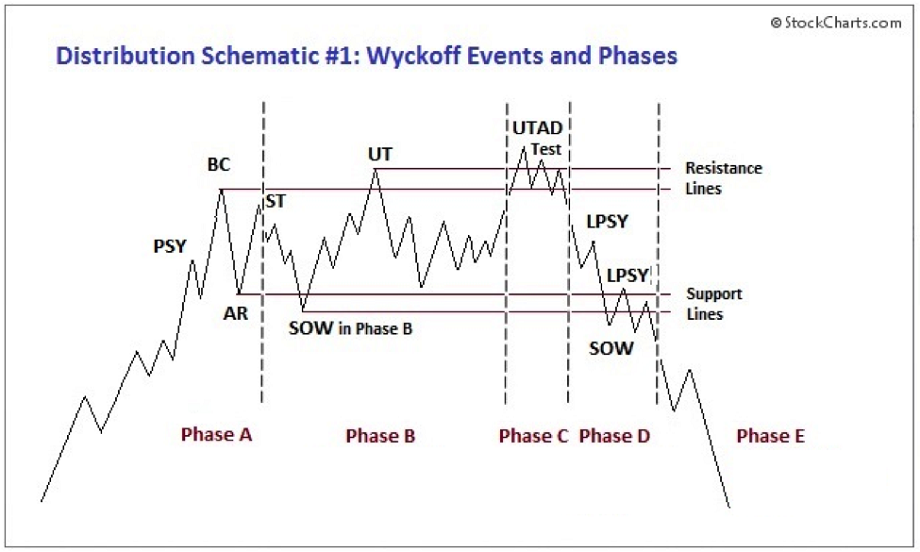
WYCKOFF DISTRIBUTION SCHEMATIC The last 2 trading days have been awfully quiet so now is a good time for some educational yet applicable content. I have […]
August 31, 2020
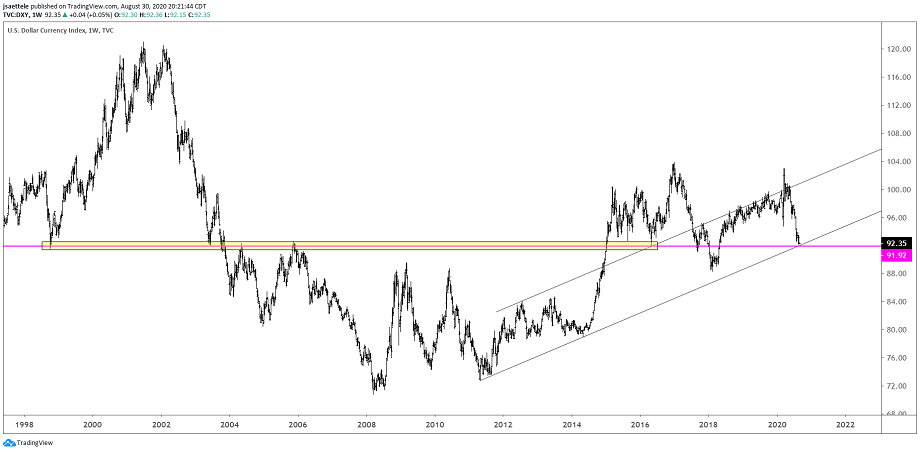
Is DXY still ‘trying’ to bottom? If so, then it needs to turn up around 92, which is the line off of the 2011 and 2014 lows (arithmetic scale). 91.50-92.00 has also been a major pivot since 1998. I sound like the boy who cried wolf but I’m on alert for a turn higher.
August 26, 2020

These 3 charts are from Nordea’s latest FX Weekly. The relationships between the Fed’s balance sheet / USD, Trump’s job approval / USD, and EURUSD / US-Europe Covid case count spread all point to a stronger USD from current levels.
August 4, 2020
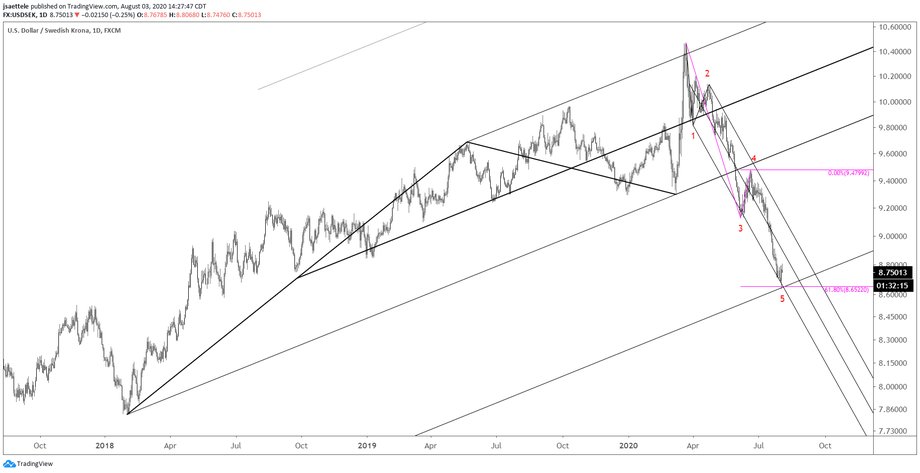
USDSEK nailed support and reversed higher on Friday from the noted channel extension and Fibonacci relationship. I’m looking for a sizable rebound in the coming weeks and maybe longer. Near term levels to pay attention to are the center line of the channel from the March high near 8.89 and the upper parallel, which is currently about 9.10.
July 20, 2020

Seasonal tendencies are now bullish-sideways for DXY (and bearish-sideways for EURUSD) through mid-August. The biggest shift in seasonal tendencies however is in the commodity currency complex. AUDUSD and NZDUSD enter their most bearish period of the year starting now. USDCAD is in its most bullish period of the year. Nasdaq seasonal tendencies are bearish through August 14th. These charts are shown below.
July 14, 2020
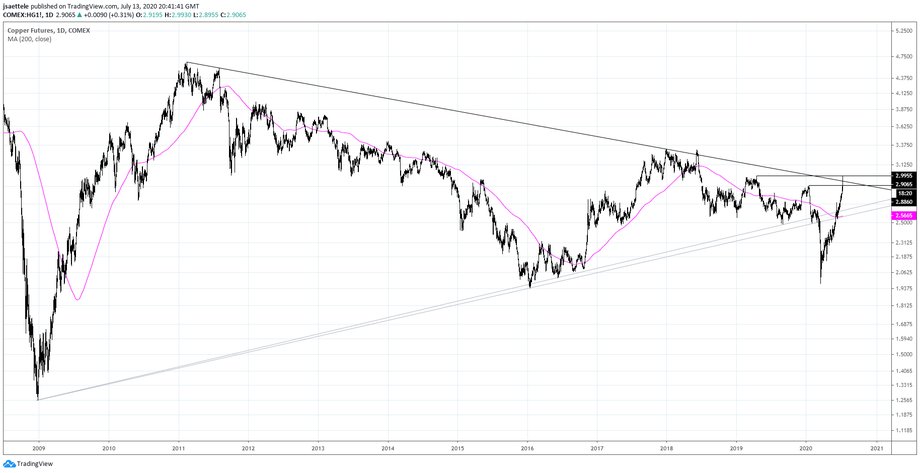
Copper nearly took out the 2019 high today before reversing lower. The reversal also occurred after price spiked above the trendline from 2011. High today is also on the upper parallel of the channel from the March low. The reaction from massive overhead resistance strongly suggests that a high of importance is in place. Pay attention to the parallels within the channel from the March low (see below). The center line is near 2.84 and the lower parallel is near 2.71.
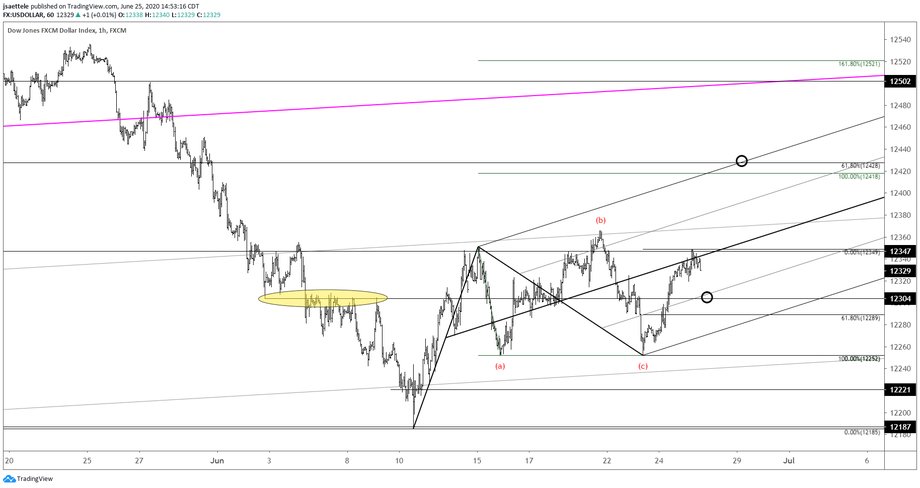
June 26, 2020
I’m looking at short term wave counts today in USD indices and the 3 cleanest USD pairs from a short term perspective. USDOLLAR focus is still on 12418/28. A flat pattern unfolded from the 6/15 high. The rally from 6/23 is impulsive so focus is on buying support, probably in the 12289-12304 zone.